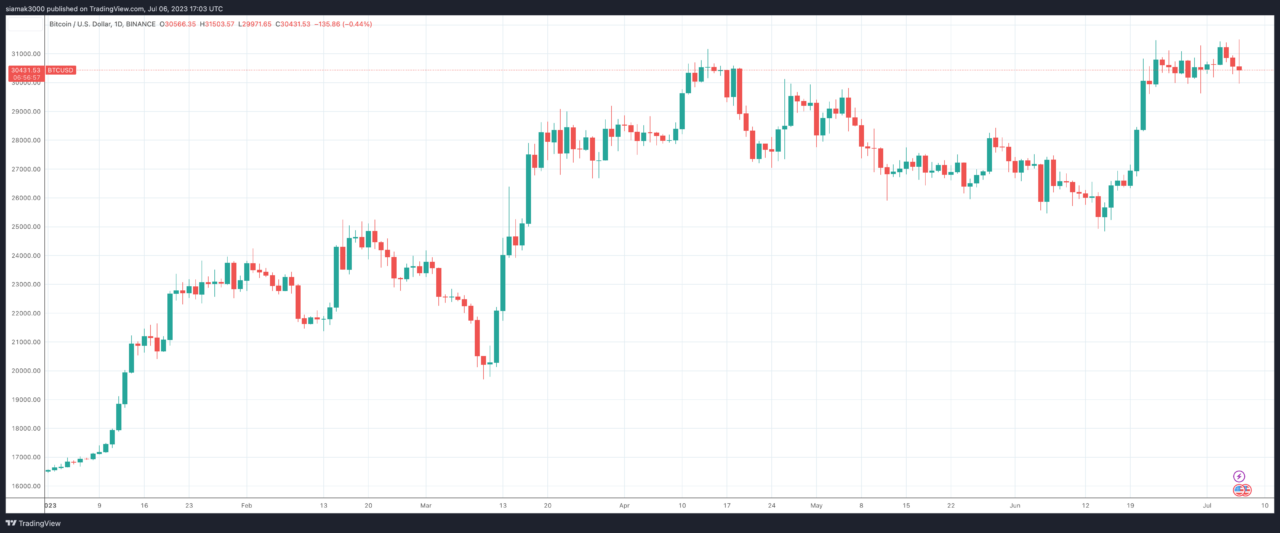
Current Market Status
As of 4:15:32 p.m. UTC on 6 July 2023, the real-time data shows that — on Binance — Bitcoin (BTC/USD) is trading at $30,405.3, with an increase of $50.0 (+0.16%). The volume stands at 65,663 BTC, with a bid/ask spread of $30,405.3/$30,405.3. The day’s range has been between $29,888.0 and $31,500.0.
Technical Indicators
Technical indicators are a series of statistical calculations used by traders to predict future price movements. They provide a way to look at market behavior and compare current and past performances. Here, we’ll look at the daily, weekly, and monthly technical indicators for Bitcoin.
Daily
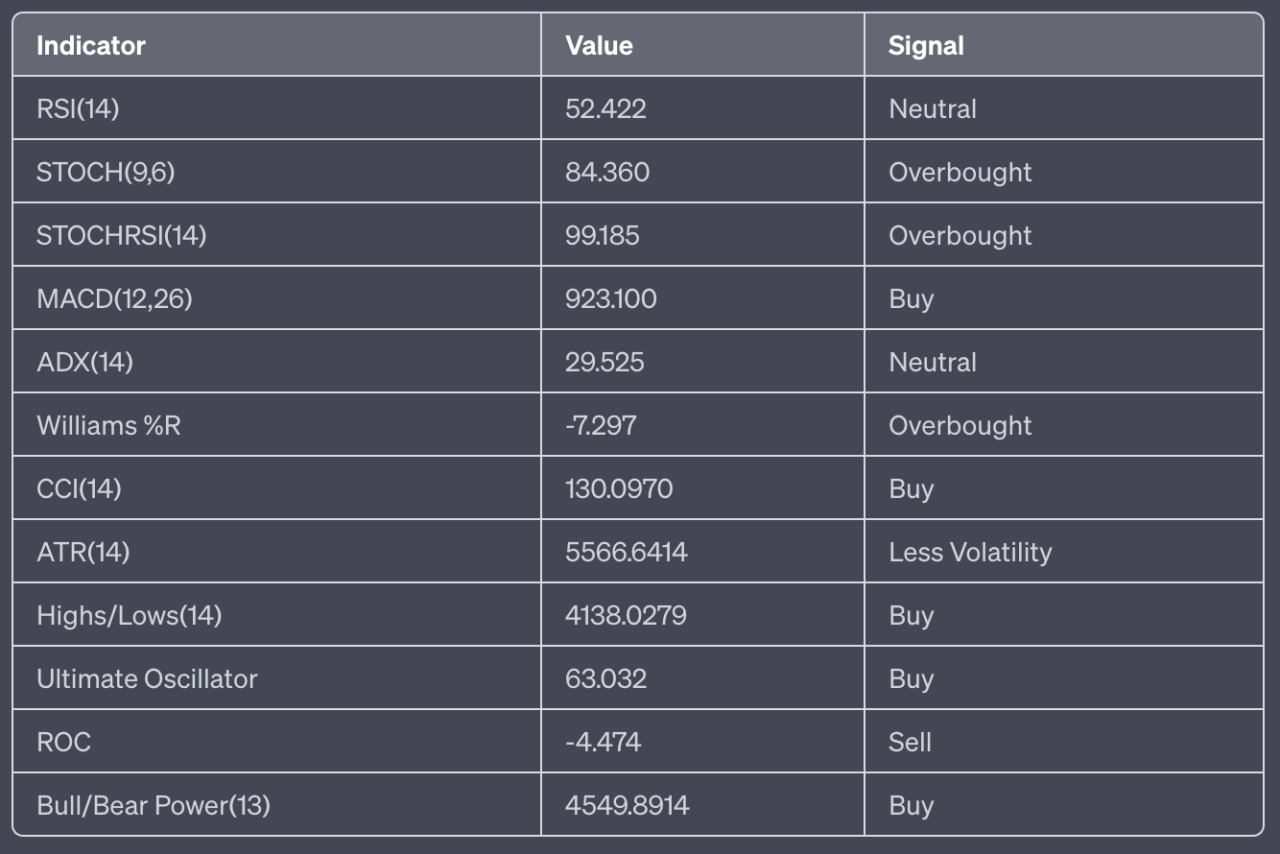
The daily technical indicators provide a snapshot of Bitcoin’s trading momentum and potential price changes over a single day. Here are the daily technical indicators for Bitcoin:
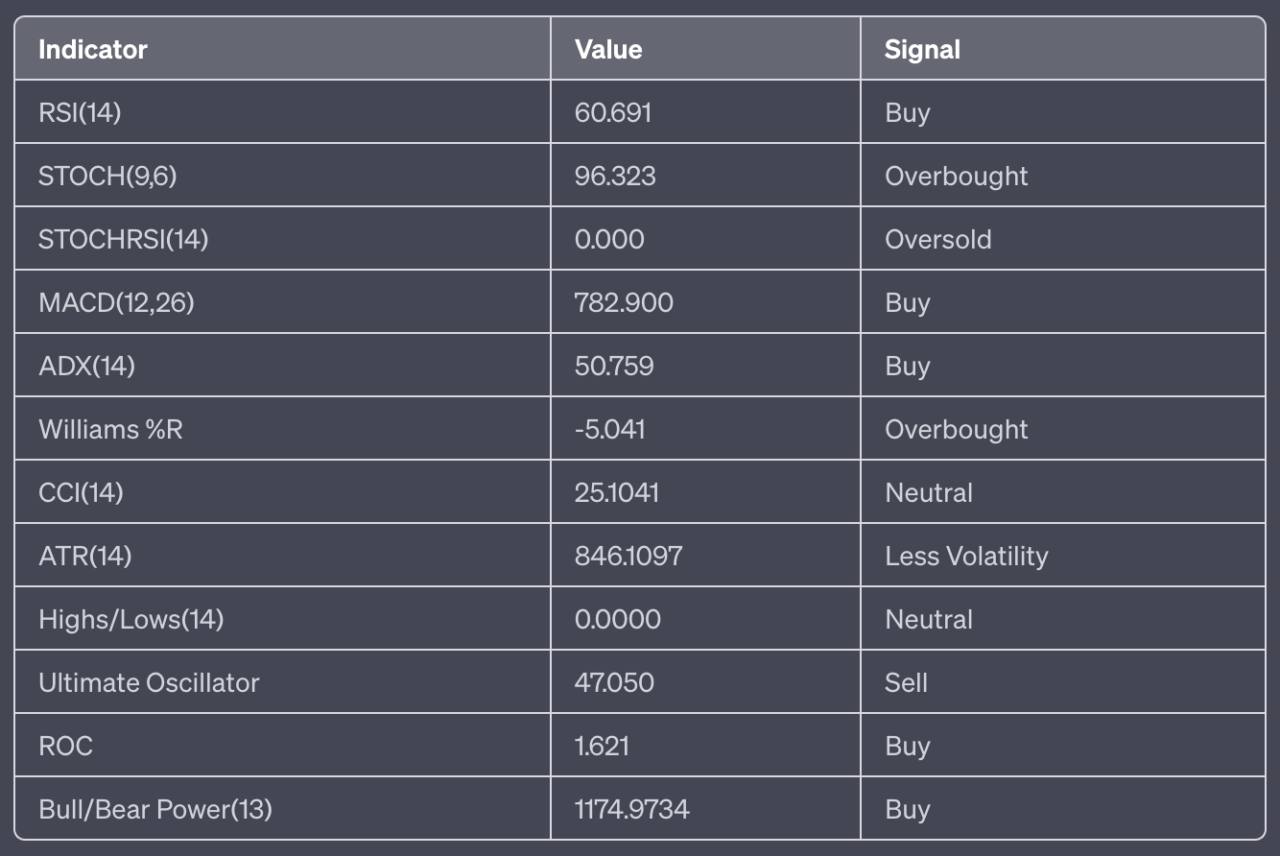
The daily technical indicators suggest a “BUY” signal for Bitcoin, with five buy signals, one sell signal, and two neutral signals. The RSI and MACD both suggest a buy signal, indicating bullish momentum. However, the STOCH and Williams %R indicate that Bitcoin is currently overbought, which could suggest a potential price correction in the near future.
Weekly
The weekly technical indicators provide a snapshot of Bitcoin’s trading momentum and potential price changes over a single week. Here are the weekly technical indicators for Bitcoin:
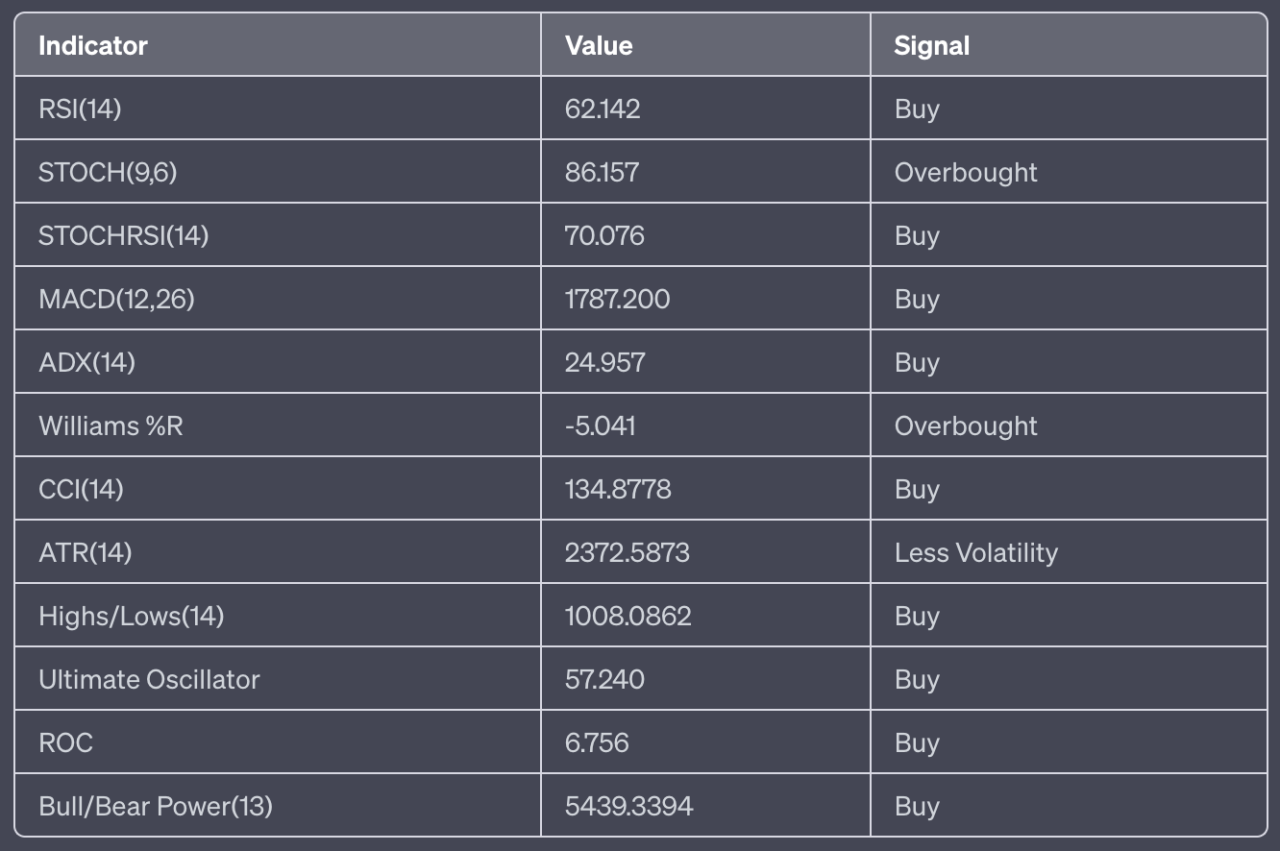
The weekly technical indicators suggest a “STRONG BUY” signal for Bitcoin, with nine buy signals and no sell signals. The RSI, MACD, and CCI all suggest a buy signal, indicating bullish momentum. However, the STOCH and Williams %R indicate that Bitcoin is currently overbought, which could suggest a potential price correction in the near future.
Monthly
The monthly technical indicators provide a snapshot of Bitcoin’s trading momentum and potential price changes over a single month. Here are the monthly technical indicators for Bitcoin:
The monthly technical indicators suggest a “BUY” signal for Bitcoin, with five buy signals, one sell signal, and two neutral signals. The MACD, CCI, and Bull/Bear Power all suggest a buy signal, indicating bullish momentum. However, the STOCH, STOCHRSI, and Williams %R indicate that Bitcoin is currently overbought, which could suggest a potential price correction in the near future.
Moving Averages
Moving averages are used to smooth out price data to help traders better identify the trend direction. Here are the moving averages for Bitcoin:
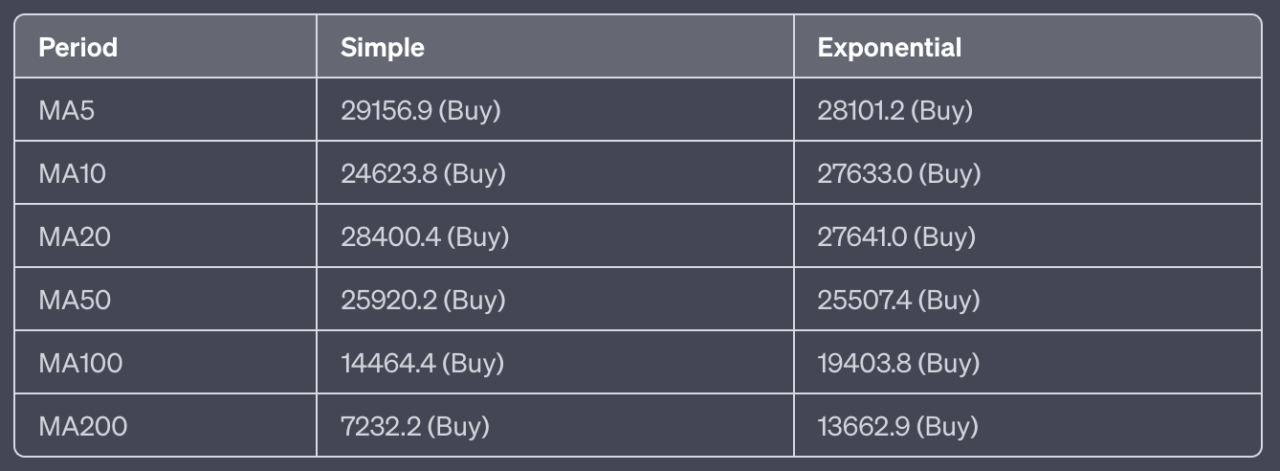
In summary, the moving averages suggest a “STRONG BUY” signal for Bitcoin, with all twelve signals indicating a buy. This suggests that the price is above the average of the past 5, 10, 20, 50, 100, and 200 days, which is a bullish signal.
Conclusion
Taking into account the technical indicators and moving averages, the overall sentiment for Bitcoin on 6th July 2023 is bullish. The daily, weekly, and monthly technical indicators mostly suggest a buy signal, indicating bullish momentum. However, there are signs of Bitcoin being overbought, which could lead to a potential price correction in the near future. The moving averages also suggest a strong buy signal, indicating that the price is above the average of the past several days. Despite the potential for short-term price corrections due to overbought conditions, the overall trend for Bitcoin appears to be bullish.
Investors should be aware of these mixed signals and consider their investment strategies accordingly. It’s important to note that these insights are based on the current market conditions and historical data, and market dynamics can change rapidly. Therefore, investors should use these insights in conjunction with other market information and their own research when making investment decisions.
Featured Image Credit: Photo / illustration by “Dylan Calluy” via Unsplash