Last week’s quantitative sentiment analysis gave some basic insights into the social sentiment data Altcoin Analytics offers. This week will be taking a further look into how the quantitative sentiment measures behave in relation to recent crypto market events.
The last month has seen negative price movement in the overall crypto market. Although mainstream media attributes this to the Coinrail hack and the continuation of the bear market, sentiment indicators showed a large decrease in sentiment weeks preceding the decline. The figure below shows average textual sentiment for about 100+ cryptocurrencies over time. Sentiment has clearly been trending downwards over the past month as seen in the charts below.

Sentiment in the graph above is calculated using algorithmic text analysis which classifies a Tweet as positive or negative on a scale from +1 to -1, this is done per individual tweet over 100+ cryptocurrencies. By looking at sentiment over time it establishes a baseline to see if sentiment is becoming more positive or more negative. As with all quantitative models, they will never be finished. But by looking at how they progress and placing them in to context they can provide for in interesting view of the market.

A sharp drop in sentiment since late May has been established which is in keeping with the bear market. However, due to the nature of cycles in markets, it is hard to determine whether this sentiment was caused by the bear market or causes the bear market. One can argue that market sentiment is what contributes to extreme bull and bear cycles. The falling sentiment does show signs of slowing its descent in mid-June, however, it is too early to draw conclusions from this indicator alone.
Also, exposure (measured as total recipients of crypto tweets) has shown a gradual decrease over the last few weeks. Exposure tells us something about how many people are receiving crypto related tweets, but not how positive or negative it is.
Exposure is measured as the number of Tweets on cryptocurrencies weighted by number of followers a Tweet author has.
The level of exposure measured in millions reached on twitter is correlated with price, the very strong rally in April can be seen clearly in the yellow line with recipients rising over 4x by mid-April. Since Aprils rally the twitter reach has started to stabilize around 2 million suggesting lower volatility.
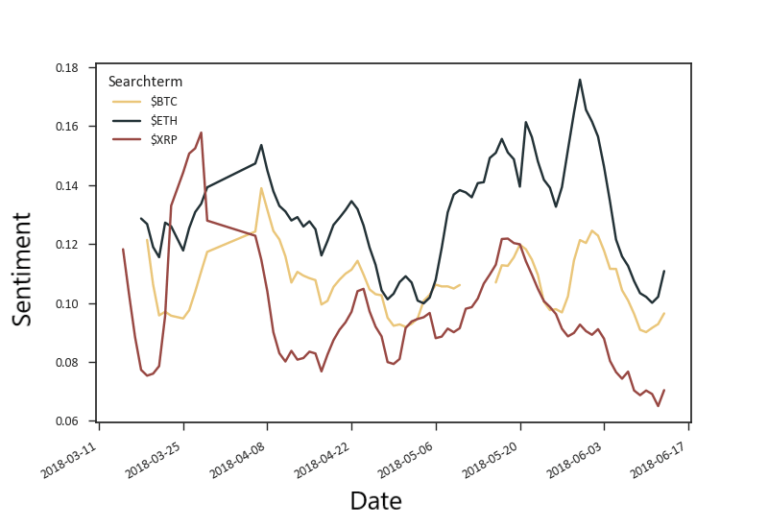
The chart below compares the average sentiment of tweets for the three largest cryptocurrencies Bitcoin (BTC), Ethereum (ETH) and Ripple (XRP). All have dropped in the past three months, however, Bitcoin and Ethereum have managed to maintain a more positive sentiment compared to Ripple, in much the same way Bitcoin and Ethereum have suffered a smaller drop in value since December than Ripple has.

Will sentiment exactly predict price movements? No probably not, there is always noise and regime shifts, also fundamentals can change without the large masses knowing about it. But sentiment does seem to provide for some interesting signals that seem to pick changing dynamics in the crypto space. Tune in next week to see how sentiment has shifted or go to AltcoinAnaltycs.com and subscribe to their free newsletter.


