The VIX, or Volatility Index, is an essential financial metric developed by the Chicago Board Options Exchange (CBOE) that quantifies market expectations of near-term volatility, particularly over the next 30 days, based on the prices of S&P 500 index options. Often referred to as the “Fear Index” or “Fear Gauge,” the VIX is pivotal in understanding investor sentiment and market stability.
The VIX measures the market’s anticipated volatility by analyzing the prices of put and call options on the S&P 500 index. These options represent bets on whether the index will rise or fall, and their prices reflect the degree of uncertainty or risk perceived by investors. Essentially, the VIX captures the market’s collective expectation of how volatile the S&P 500 will be in the short term.
The index is calculated using a complex formula that incorporates the prices of multiple S&P 500 options with varying strike prices and maturities. The resulting value is expressed as a percentage, representing the expected annualized change in the S&P 500 index over the next 30 days. For example, a VIX value of 20 suggests an anticipated annualized volatility of 20%, implying a monthly volatility of around 5.77%.
The VIX is often dubbed the “Fear Index” or “Fear Gauge” because it rises during times of market stress or uncertainty. When investors are fearful of potential market declines due to economic instability, geopolitical tensions, or unexpected financial events, they tend to buy more options as a form of protection or speculation, driving up option prices and, consequently, the VIX. Conversely, when the market is stable and investor confidence is high, option prices tend to be lower, leading to a lower VIX value.
Here is why VIX is so important for investors and traders:
- Market Sentiment Indicator. The VIX provides a real-time snapshot of market sentiment. A rising VIX indicates increasing fear and uncertainty, suggesting that investors are anticipating greater market volatility. This information is invaluable for traders and investors as it helps them gauge the overall mood of the market and adjust their strategies accordingly.
- Risk Management. Investors use the VIX to manage risk in their portfolios. For instance, during periods of high VIX, indicating high volatility, investors might reduce their exposure to equities or increase their use of hedging strategies such as buying put options or investing in volatility-related products. Conversely, a low VIX might encourage investors to take on more risk, as it suggests a stable market environment.
- Hedging and Speculation. The VIX is also a popular tool for hedging and speculation. Financial instruments such as VIX futures and options allow investors to hedge against potential market downturns or to speculate on future volatility. By taking positions in these instruments, investors can profit from increases in market volatility or protect their portfolios from significant losses during turbulent times.
- Economic Indicator. Beyond the financial markets, the VIX serves as an economic indicator. High VIX values can signal broader economic concerns, such as looming recessions or financial crises. Policymakers and economists monitor the VIX to understand the underlying health of the financial system and to make informed decisions about monetary and fiscal policies.
Traders closely watch the VIX for signals about future market movements. A sudden spike in the VIX might indicate that a market correction is imminent, prompting traders to take defensive positions. On the other hand, a declining VIX can suggest that the market is settling down, encouraging traders to take on more risk.
Moreover, the VIX is often used in conjunction with other technical and fundamental indicators to develop comprehensive trading strategies. For example, traders might look for divergences between the VIX and the S&P 500 index. If the S&P 500 is rising while the VIX is also increasing, it could signal that the market rally is unsustainable, and a reversal may be near.
The VIX surged this week after a long period of calm, prompting concerns about the duration of the summer stock market selloff. Following Thursday’s gains, the VIX spiked significantly on Friday, driven by a disappointing labor market report that suggested the U.S. economy might be on the brink of a recession. In fact, it surged over 25% to reach its highest level since March 2023.
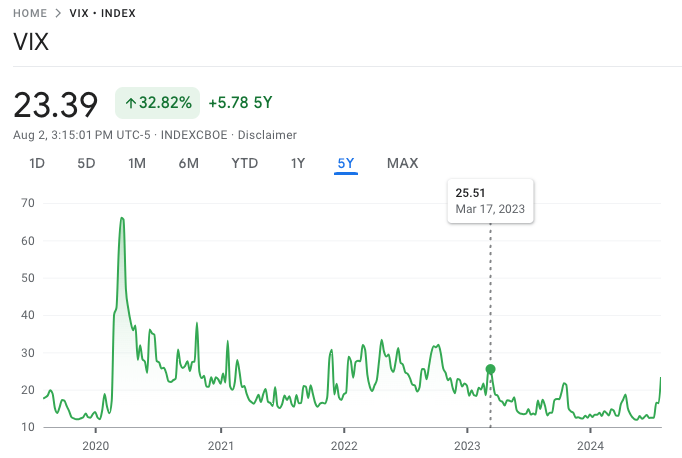
On August 2, Chris Murphy, co-head of derivatives strategy at Susquehanna International Group, appeared on CNBC’s “Market Sell-Off” special. During this segment, Murphy provided an in-depth analysis of the day’s market turmoil, characterized by a significant spike in the CBOE Volatility Index (VIX), which surged to 29.66.
Murphy began by highlighting the context of the VIX spike, which coincided with a weaker-than-expected jobs report. This report triggered a sharp decline across major indices, reflecting heightened investor anxiety. According to Murphy, the VIX’s jump to its highest close in over a year underscores the prevailing sense of panic and uncertainty among market participants.
A notable aspect of Murphy’s analysis centered on the concept of term structure inversion in the VIX. This phenomenon occurs when short-term volatility expectations exceed those for the medium and long term. Murphy explained that such inversions often indicate that market stress is concentrated in the immediate future, suggesting that the worst of the panic may already be priced in.
Remarkably, Murphy pointed out that in approximately 80-90% of cases where term structure inversion occurs, the S&P 500 tends to be higher a month later. This counterintuitive observation suggests that sharp, rapid spikes in the VIX can sometimes be bullish signals, as they reflect a capitulation of fear that sets the stage for a market rebound.
However, Murphy cautioned against complacency. He posed a critical question: Are we facing a scenario akin to the COVID-19 pandemic or the Great Financial Crisis, where market stress persists and deepens? Alternatively, is the current situation driven by positioning imbalances and short-term pain in crowded trades?
Murphy suggested that the latter scenario is more likely. He noted that the protracted period of rate hikes had taken longer than expected to impact the job market, leading to an accumulation of offside positions. He believes that this buildup of risky bets may now be unwinding, causing short-term discomfort but not necessarily heralding a systemic crisis.
Murphy’s insights extended to investor behavior in the face of recent volatility. He observed that despite the market turmoil, a consistent trend emerged: investors were selling downside puts. He said that this strategy involves selling options that pay off if the market declines further, essentially signaling a willingness to buy stocks at lower prices.
According to Murphy, this behavior indicates a certain level of confidence among investors, who appear undeterred by short-term volatility. Murphy highlighted a specific example involving Amazon, which saw significant put selling after a disappointing earnings report. He thinks this suggests that investors view the current weakness as an opportunity to acquire fundamentally strong stocks at more attractive valuations.
Featured Image via Unsplash