The price of Ethereum rival Solana (SOL) has moved up over 14% over the past week to now trade at around $160 amid a wider cryptocurrency market recovery that started after pro-crypto presidential candidate Donald Trump suffered a failed assassination attempt.
According to popular cryptocurrency analyst Ali Martinez, the price of SOL may now keep on surging to reach the $174 level after the formation of a key technical pattern that points to its continued price recovery.
In a post shared on the microblogging platform X (formerly known as Twitter) with Martinez’s over 60,000 followers, he shared a chart showing a “W” pattern for Solana, which is often interpreted as a bullish reversal signal. The pattern, more commonly referred to as a double bottom, points to a momentum reversal from a prior market downturn.
Solana Price Analysis
A look at Solana’s price chart for the year shows that the cryptocurrency’s price is currently above both its 50 period simple moving average (SMA) and above its 200 SMA, which are at $146.9 and $105.2 respectively.
This is a bullish indicator both long and short term, while the Relative Strength Index (RSI) is sitting at 60.7, slightly entering overbought territory but trending downward away from it, indicating bullish momentum.
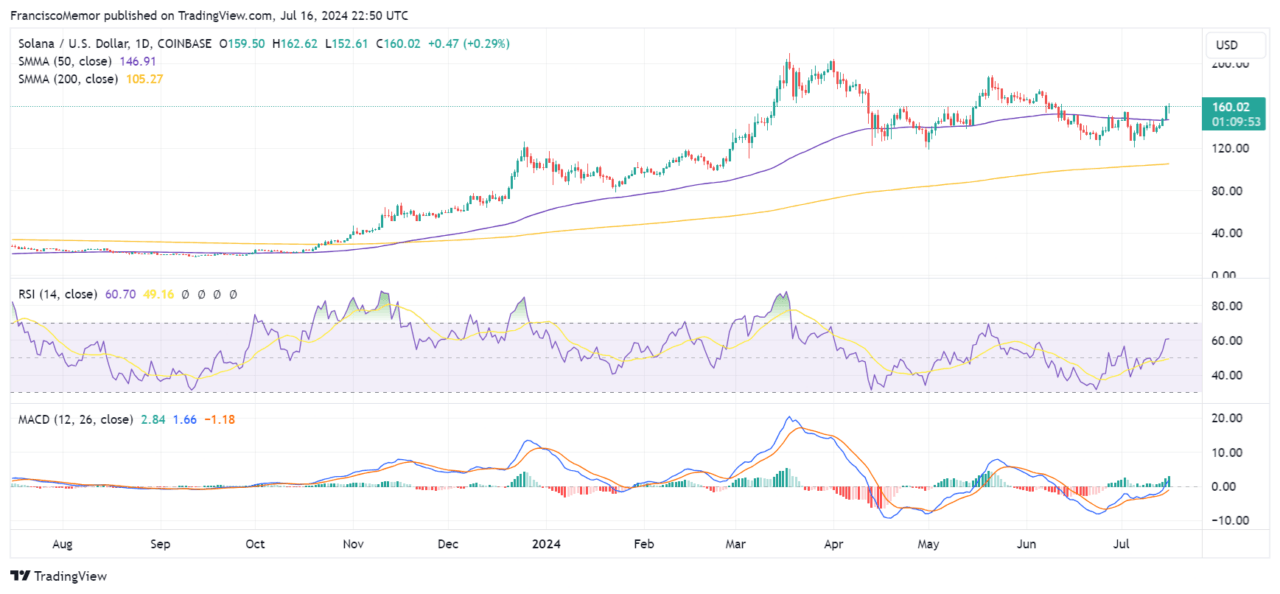
Meanwhile, the Moving Average Convergence Divergence (MACD) line is at 2.84 while the signal line is at 1.6, with the histogram showing positive values. As the MACD line crossed above the signal line, it reflects bullish momentum.
The cryptocurrency appears to have a resistance level around $162.6, and support near its 50 SMA at $146.9.
Featured image via Unsplash.