

The price of IOTA is down by nearly 3% over the last 24-hour period amid a wider cryptocurrency market downturn that has seen the space as a whole lose around $200 billion in a single day.
IOTA, a cryptocurrency designed for microtransactions between devices on the Internet of Things (IoT) using a unique consensus algorithm called Tangle, doesn’t appear to have seen specific developments justifying the price decline it saw, meaning it’s likely being affected by the wider market downturn.
At the time of writing the cryptocurrency has a market capitalization of nearly $580 million, meaning it’s below the 100 largest digital assets by market capitalization after initially being launched back in 2016.
IOTA Price Analysis
Taking a look at IOTA’s price yearly price chart we can see that the 50 simple moving average (SMA) is currently at $0.226 while the 200 SMA is at $0.246 with the cryptocurrency price below both indicators, suggesting bearish sentiment for the short and long-term.
Its Relative Strength Index (RSI) is above the 38 mark and while it appears to be approaching oversold territory it isn’t there yet. It has been trending downward and once it hits oversold territory it could be due for a bounce.
IOTA’s Moving Average Convergence Divergence (MACD) line has crossed below its signal line, showing a bearish signal amid the bearish momentum clear on the indicator’s histogram.
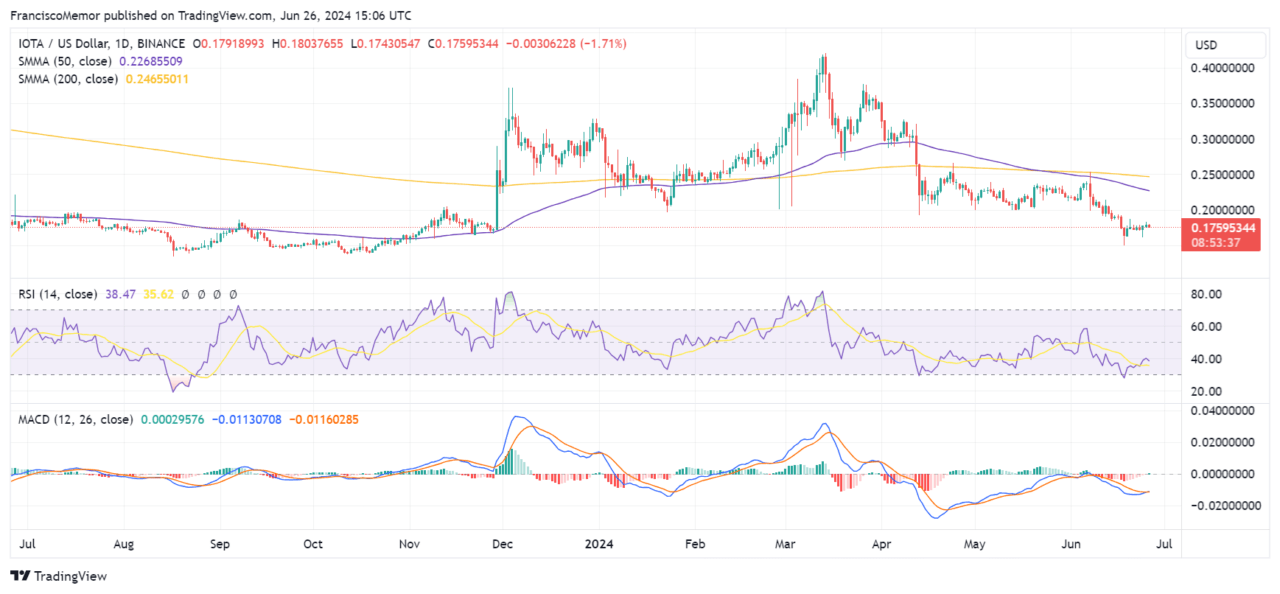
The cryptocurrency’s price has seen significant volatility ,with peaks around late 2023 followed by a correction, and is now near recent lows testing support. With IOTA currently trading at $0.174, support appears to be around this level, while a longer-term support is at $0.16.
If the trend reverses IOTA cold see resistance around the 50 SMA, or $0.226 per token, with a break above this level suggesting further upside potential.
Featured image via Unsplash.