As the cryptocurrency market continues to evolve, investors are always on the lookout for promising opportunities. Two such cryptocurrencies, Shiba Inu ($SHIB) and Floki ($FLOKI), have captured the attention of many. In this analysis, we will delve into the year-to-date (YTD) performance of SHIB-BTC, SHIB-USD, FLOKI-BTC, and FLOKI-USD pairs to determine, based on AI predictions, which cryptocurrency presents a better buying opportunity for the remainder of 2024.
Analysis of Shiba Inu (SHIB) Performance
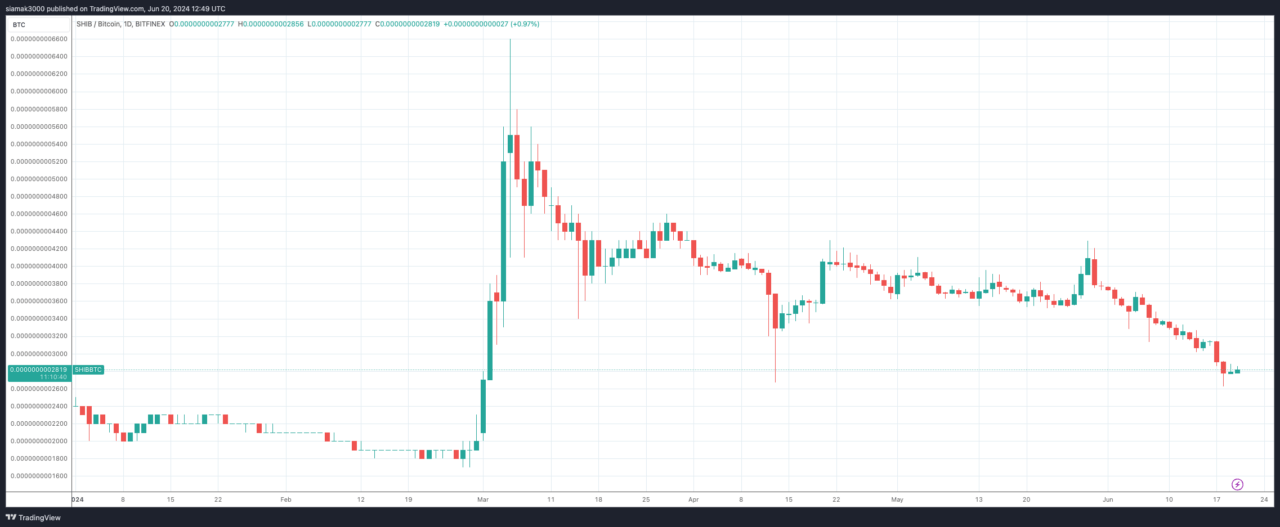
The SHIB-BTC chart showcases substantial volatility for Shiba Inu against Bitcoin. Starting the year at lower levels, SHIB experienced a significant rally in March, reaching a peak before undergoing a correction. As of mid-June, the price has stabilized around 0.0000000277 BTC.
The chart indicates that SHIB has solid support around the current levels, but the bearish trend necessitates caution. Investors should look for sustained movements above 0.0000000300 BTC to confirm a potential trend reversal.
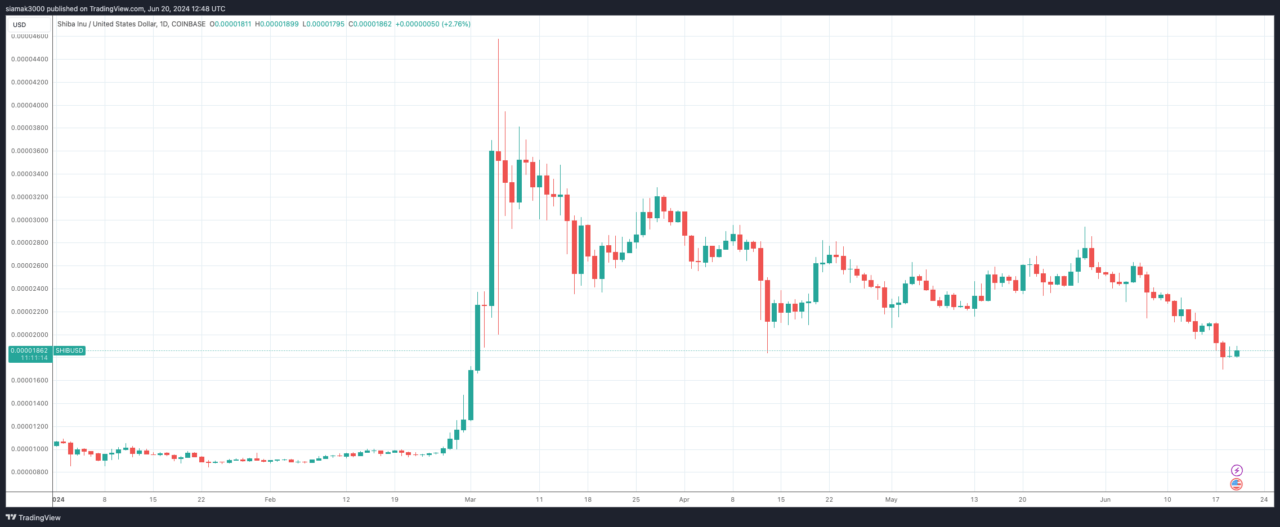
The SHIB-USD chart mirrors the pattern observed in the BTC pair. The token saw a robust rally in March, followed by a downward correction. Currently, the price is hovering around $0.000018, with significant support at $0.000016 and resistance at $0.000022. This suggests SHIB might be consolidating before its next major move. Investors should watch for a break above the resistance level to indicate a potential upward trend.
Analysis of Floki (FLOKI) Performance
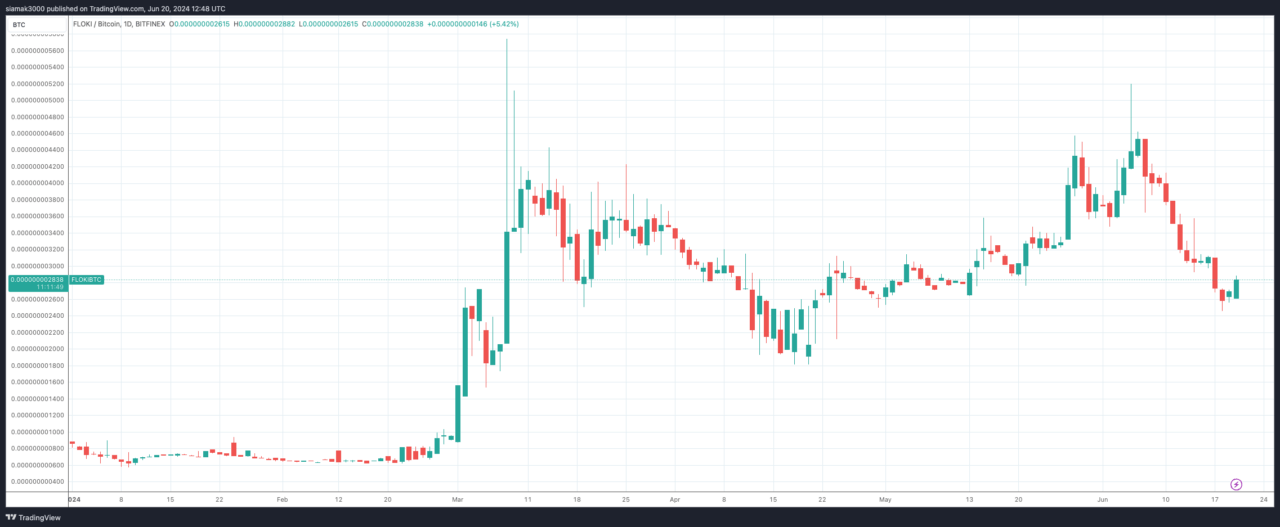
The FLOKI-BTC chart demonstrates a strong upward movement starting in March 2024, peaking in April. Since then, the token has been in a corrective phase, with the current price at approximately 0.0000000282 BTC. Key support is found at 0.0000000260 BTC, with resistance at 0.0000000300 BTC. This pattern indicates that while FLOKI has experienced significant gains, it is currently in a consolidation phase. Investors should watch for a breakout above the resistance level for signs of a renewed uptrend.
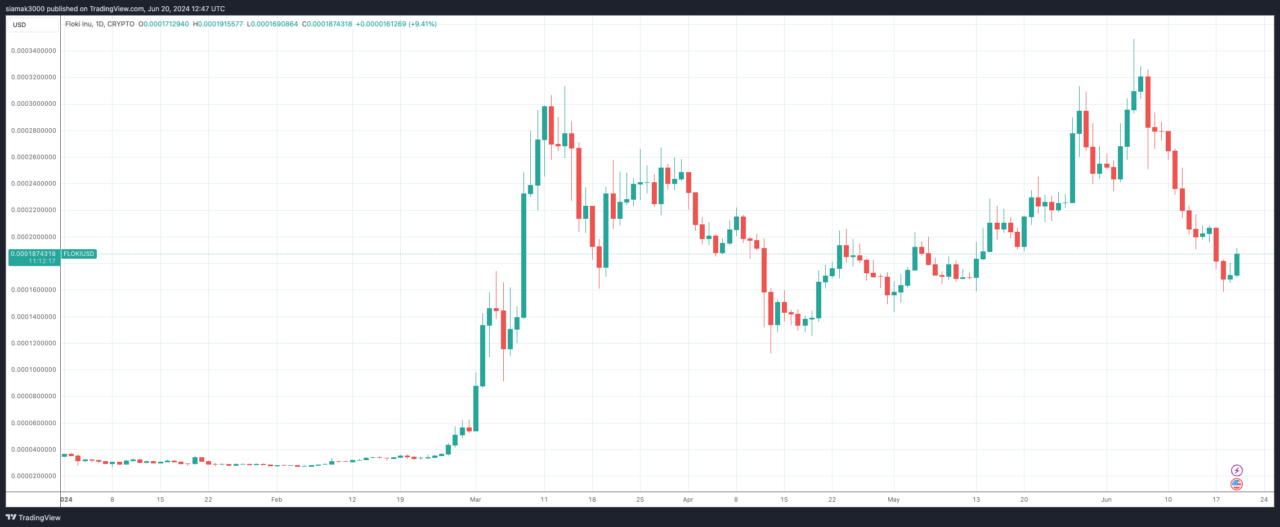
The FLOKI-USD chart shows a similar pattern to its BTC pair. The token rallied strongly in March, followed by a correction phase. As of mid-June, FLOKI is trading around $0.000187 with support at $0.000160 and resistance at $0.000200. The consolidation at these levels suggests that FLOKI might be preparing for a significant move, with a breakout above resistance potentially indicating a bullish trend.
Conclusion
Based on the analysis of the charts:
- Shiba Inu (SHIB): Exhibits strong support levels and potential for upward movement if it can break above key resistance levels. The bearish trend in recent months suggests caution, but the consolidation phase could indicate a setup for future gains.
- Floki (FLOKI): Shows a similar pattern of initial strong gains followed by consolidation. The presence of clear support and resistance levels provides guidance for potential future movements. A breakout above resistance could signal a renewed upward trend.
Given the current market conditions and the analysis provided, Floki ($FLOKI) appears to be the more promising investment for the remainder of 2024. Its chart patterns suggest a potentially stronger setup for gains if it can break above its resistance levels, particularly in USD terms.
Important Warning: This analysis and prediction were generated by AI (more specifically, OpenAI’s ChatGPT 4o). The cryptocurrency market is extremely volatile, and this post should not be considered financial advice of any kind. Readers should be aware of the very high risks involved in cryptocurrency investments and conduct their own research or consult with a financial advisor before making any investment decisions. Do not base any financial decisions solely on this analysis.
Featured Image via Pixabay