A key technical indicator suggests that the price of the flagship cryptocurrency Bitcoin could soon top the $100,000 mark, despite currently being in a bearish trend that has seen its price drop from a high of $72,000 to around $63,500.
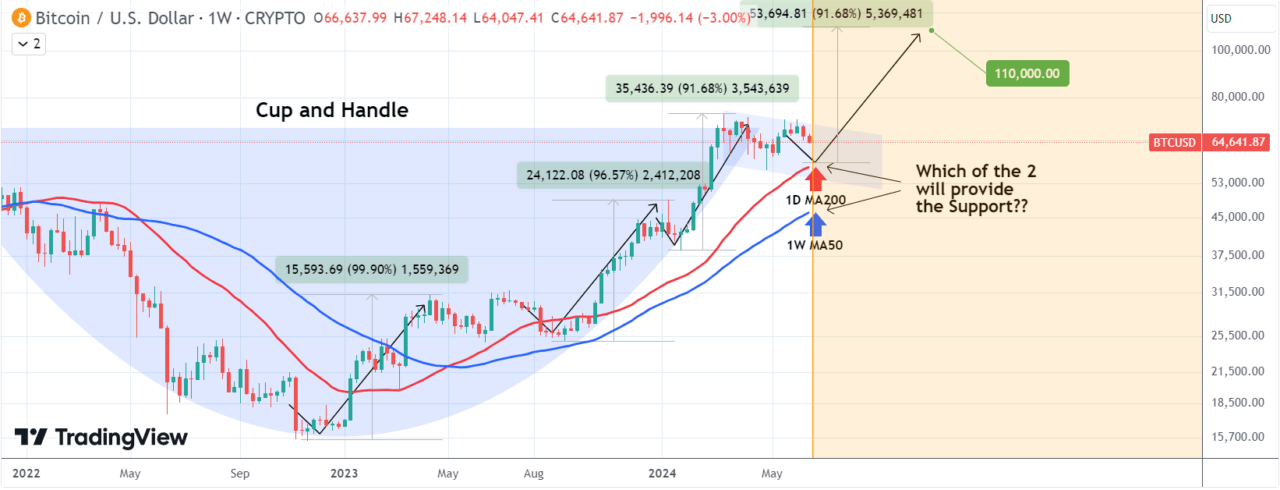
According to technical analysis published on TradingView by cryptocurrency trader TradingShot, Bitcoin’s price chart on the weekly timeframe has formed a giant cup and handle pattern.
A cup and handle pattern occurs when the price of a security trends downward and recovers to form a “u” shape, before seeing another slight downward drift that forms the handle. It’s widely considered a bullish signal.
According to TradingShot while the technical pattern is valid it may “have gone ignored by some as traders tend to focus either on shorter term price action or cyclical structures that are often repeated from Cycle to Cycle.”
The chart, he said, is now in the process of completing its handle as the price trends downward – with BTC recently dropping from around $65,00 to $63,500 – and how long it’ll take for the pattern to be completed “largely depends .. on which of the following MA [moving average] periods will hold.”
The 200-day moving average (1D MA200) has provided support earlier for a significant rebound, while the 50-week moving average (1W MA50) has been a reliable support level since March 2023.
The cup portion of the pattern formed between early 2022 and mid-2023, while the handle has been taking shape through a downward channel into 2024. Looking ahead, the analysis examines the potential upside after the handle completes.
Since the bottom of the bear cycle in November 2022, Bitcoin has experienced three upward price movements ranging from 91% to 99%. The analyst suggests that the next expansion leg could propel Bitcoin to a target zone of $100,000 – $110,000, assuming the 1D MA200 holds as support.
Notably, data shows the recent BTC price plunge has seen investors become “mainly fearful or disinterested” toward the cryptocurrency.
That’s according to on-chain analytics firm Santiment, which noted in a post on the microblogging platform X (formerly known as Twitter) that “this extended level of FUD [Fear Uncertainty and Doubt] is rate, as traders continue to capitulate.”
Per the firm bitcoin trader “fatigue” combined with an ongoing whale accumulation “generally leads to bounces that reward the patient.”
Featured Image via Unsplash