

The meme-inspired cryptocurrency Dogecoin ($DOGE) could be poised to “surge incredibly” as a little-known technical indictor is suggesting the cryptocurrency’s price is due for a breakout.
According to a popular pseudonymous cryptocurrency analyst on the microblogging platform X (formerly known as Twitter), Trader Tardigrade, the Gaussian Channel (GS) indicator turned green on Dogecoin’s weekly chart, which means that when the time is right Dogecoin “will surge incredibly.”
Tardigrade further bolstered his argument by highlighting two previous instances where similar chart patterns emerged for Dogecoin, in 2016-2018 and 2021-2022. In both cases, the analyst noted, DOGE ended up reaching new all-time highs, as evidenced by the chart.
As reported, large DOGE investors, colloquially knwon as whales, have been divesting of their holdings in the largest meme-inspired cryptocurrency by market capitalization, with their supply of it dropping from 45.3% to 31.3% over the past year.
According to data shared by IntoTheBlock, over the past year DOGE holders with more than 0.1% of the cryptocurrency’s supply have been selling, while retail and mid-sized investors now hold a larger share of the cryptocurrency’s supply.
These whales divestments come at a time in which crowd sentiment for the meme-inspired cryptocurrency has been plunging for DOGE, rival memecoin Shiba Inu, and the native token of the XRP Ledger, XRP, according to data from on-chain analytics firm Santiment.
Per the firm, patient traders who have been “waiting for the crowd to give up on these large cap altcoins may finally have their buy opportunity with FOMO [fear of missing out] at a 2024 low.”
DOGE Price Analysis
Dogecoin is at the time of writing trading at $0.124 per token after moving up nearly 90% in the past year, but after losing nearly 27% of its value over the last 30-day period amid a wider cryptocurrency market downturn.
Technical analysis of Dogecoin’s yearly price chart suggests the cryptocurrency is dealing with bearish short-term sentiment while holding onto a potential long-term bullish trend as its price is below the 50-SMA and above the 200-SMA, located at $0.146 and $0.114 respectively.
Its Relative Strength Index (RSI) is currently at around 32.5, considered to be oversold territory, and is trending downward over the ongoing bearish momentum, although a hosrt-term bounce would reverse this.
DOGE’s Moving Average Convergence Divergence (MACD) line has crossed below its signal line, indicating a bearish signal.
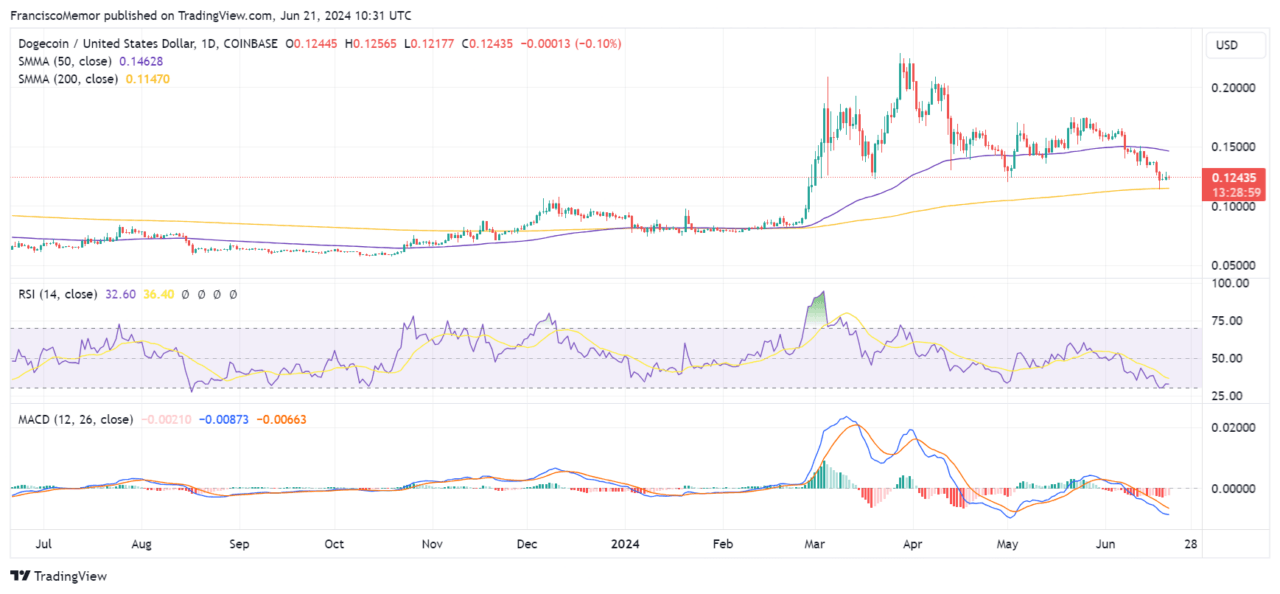
The price chart suggests immediate resistance is around the 50-SMA level, $0.146, and a support level at its recent low near the 200-SMA or $0.114.
Featured image via Unsplash.