Earlier today, IntoTheBlock (ITB), a prominent data analytics firm in the cryptocurrency sector, shared — on social media platform X — an in-depth analysis of Bitcoin’s market behavior following the launch on January 11 of eleven U.S. spot Bitcoin ETFs.
Overview of Bitcoin’s Price Dynamics
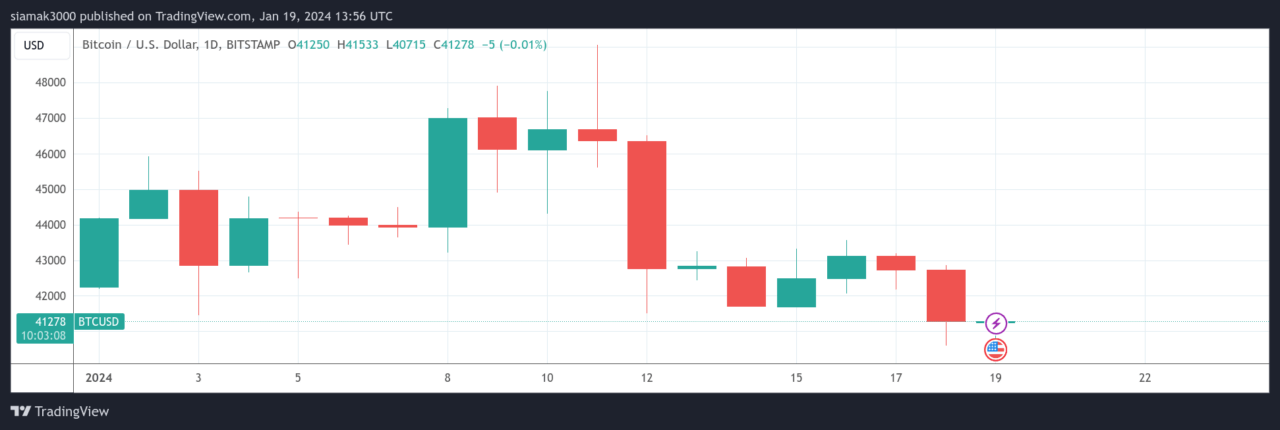
ITB noted that despite expectations to the contrary, Bitcoin’s price experienced a 10% decline over the past week, continuing a downward trend since the approval of the Bitcoin ETF. This observation sets the stage for a deeper exploration into the factors driving these market movements.
Exchange Inflows and Selling Behavior
The analysis highlighted a significant trend: Bitcoin has seen a continuous inflow into centralized exchanges (CEXs) for six consecutive weeks, totaling nearly $2 billion since December. ITB interprets high exchange deposits as a typical indicator of selling activity, raising the question of who is selling Bitcoin during this period.
Transaction Patterns and GBTC Impact
One key observation is the record-high average holding time of transacted Bitcoin coins, which reached an all-time peak on Monday, followed by the second-highest weekly average. ITB suggests that older coins are being moved, possibly by investors exiting the Grayscale Bitcoin Trust (GBTC).
Wallet Balance Trends
ITB’s research reveals diverging trends among Bitcoin holders. Wallets holding more than 1,000 Bitcoin have been accumulating more, while those with less than 1,000 Bitcoin have reduced their holdings in January. This pattern indicates a shift in the distribution of Bitcoin across different wallet sizes.
Behavior of Short-Term vs. Long-Term Holders
ITB says that most of the wallet addresses reducing their Bitcoin balances are those that held Bitcoin for 1-12 months. In contrast, it points out that long-term holders have not been purchasing as aggressively as in previous months, with a slight decrease in their overall Bitcoin holdings. However, ITB notes a significant rise in Bitcoin held by short-term holders (or traders) since October 2023, a trend typically associated with bull markets.
Market Top Signals and Bull Market Indicators
ITB goes on to say that while the transfer of Bitcoin from long-term to short-term holders often signals market tops, the current situation differs from previous instances. ITB points out several indicators suggesting that the market is not experiencing a typical top: the trading volume is lower compared to past bull markets, the decrease in Bitcoin held by long-term holders is limited, and the Market Value to Realized Value (MVRV) ratio is relatively modest at 1.88.
At the time of writing, Bitcoin is trading at around $41,272, down 2.8% in the past 24-hour period.

Featured Image via Unsplash


