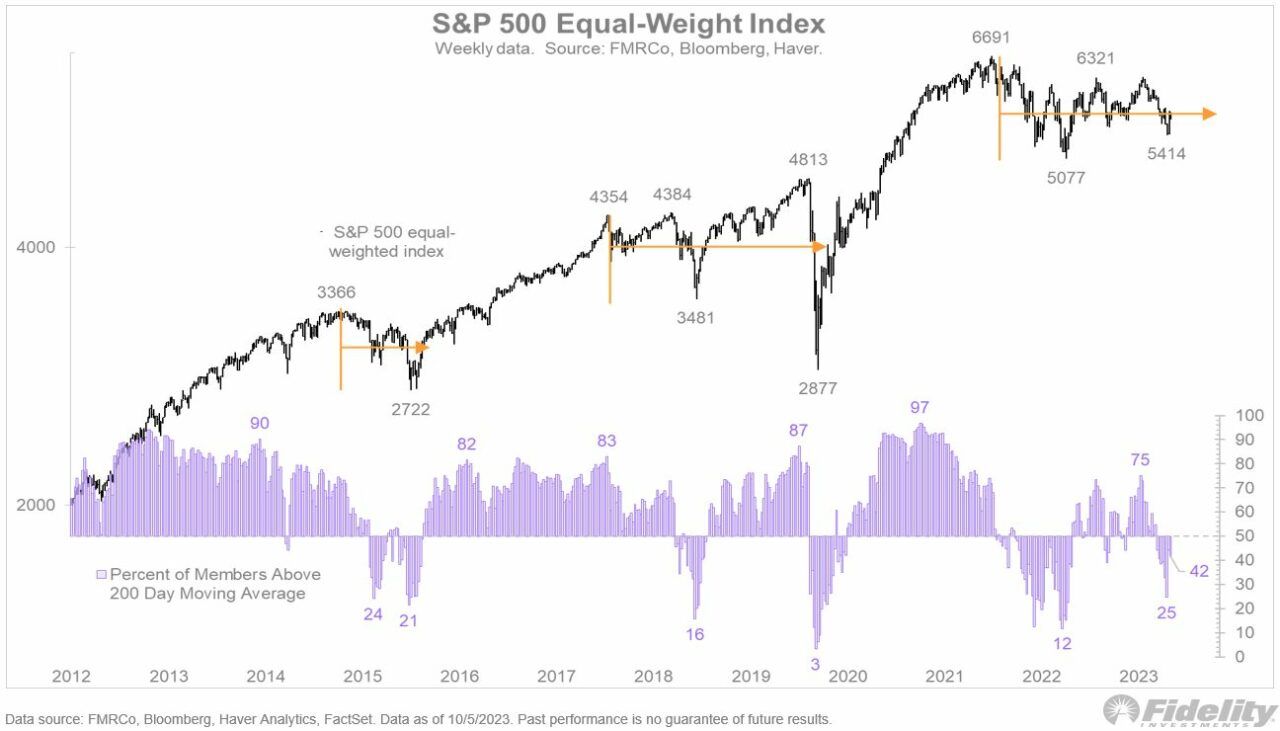
Jurrien Timmer, the Director of Global Macro at Fidelity Investments, shared his insights on the U.S. stock market in a LinkedIn post dated November 13. His analysis provides a nuanced understanding of the current market trends and future prospects.
Equity Market Recovery: Timmer begins by noting the ongoing recovery of equities, highlighting the market’s potential to break out of a nearly two-year holding pattern. He points out that such prolonged periods of stagnation are not uncommon, referencing similar phases in 2018 and 2015.
Market Trends and Probabilities: Timmer observes that the stock market typically experiences more upward movement than downward, with a positive trend 60-70% of the time. He suggests that the current trading range could be a precursor to another market advance. He explains that market corrections can occur in terms of price or time, and the current phase appears to encompass both.
Price-Earnings Relationship: He discusses the complex relationship between price-to-earnings (P/E) ratios and market returns. Timmer notes that the P/E component often moves inversely to the earnings part, adding to the difficulty of market timing, especially around cyclical inflection points.
Stock Prices and Earnings: Timmer points out that stock prices are a reflection of earnings expectations, though not always accurate. He mentions that the rally over the past 13 months was driven by expectations of an uptick in earnings. This is evidenced by the P/E multiple expansion from 15x to 20.3x since the low in October 2022.
Impact of Rising Yields: The recent increase in yields has impacted the market, according to Timmer. He notes that the rise in yields this fall has reduced the gains from the P/E multiple expansion by about half.
Earnings Performance: On a positive note, Timmer highlights that earnings are performing well. With 458 out of 500 companies reporting, there has been a year-over-year growth of +4% in third-quarter EPS. This growth is significantly higher than anticipated at the start of the earnings season.
Future Earnings Estimates: He concludes by mentioning that estimates for the fourth quarter of 2023 and the first quarter of 2024 are trending lower, which is typical behavior.

As CryptoGlobe reported in an article published on November 12, in a recent LinkedIn post, Timmer shared a detailed analysis comparing Bitcoin and gold as potential stores of value in investment portfolios. His insights are particularly pertinent for contemporary portfolio management strategies.
Timmer starts by discussing gold’s performance and its Sharpe Ratio over a five-year span. The Sharpe Ratio, which assesses risk-adjusted returns, reveals that gold has been a stable and reliable investment, surpassing many other assets in both returns and volatility.
When it comes to Bitcoin, Timmer notes its distinct risk-return profile compared to gold. Bitcoin shows a positive correlation with equities, though it’s less pronounced than other assets. This correlation is crucial for understanding Bitcoin’s behavior in various market conditions.
Timmer then explores Bitcoin’s role in a traditional 60/40 portfolio (60% stocks, 40% bonds), categorizing it under ‘alts’ (alternatives). He observes that Bitcoin’s correlation with the S&P 500 is becoming less positive and it shows a negative correlation with the US Dollar and T-Bills. Interestingly, Bitcoin remains uncorrelated with gold, suggesting they may not serve similar functions in a portfolio.
A key point in Timmer’s analysis is the convergence of the Sharpe Ratios of Bitcoin and gold. While gold has consistently performed well, Bitcoin’s Sharpe Ratio indicates a maturing market behavior, despite its historical volatility.
Timmer also compares the volatility of Bitcoin and gold, noting that Bitcoin’s volatility is about four times that of gold. By hypothetically increasing the gold position fourfold to match Bitcoin’s, their return profiles over the past five years are closely aligned. This comparison offers a framework for considering portfolio allocations in terms of equivalent risk and return.
Based on these dynamics, Timmer suggests a potential allocation strategy for an alternative 60/40 portfolio. For a 5% ‘store of value’ position, a mix of 2% in gold and 1% in Bitcoin could be equivalent to a 6% position, balancing the considerations of risk and return.
Featured Image via Pixabay


