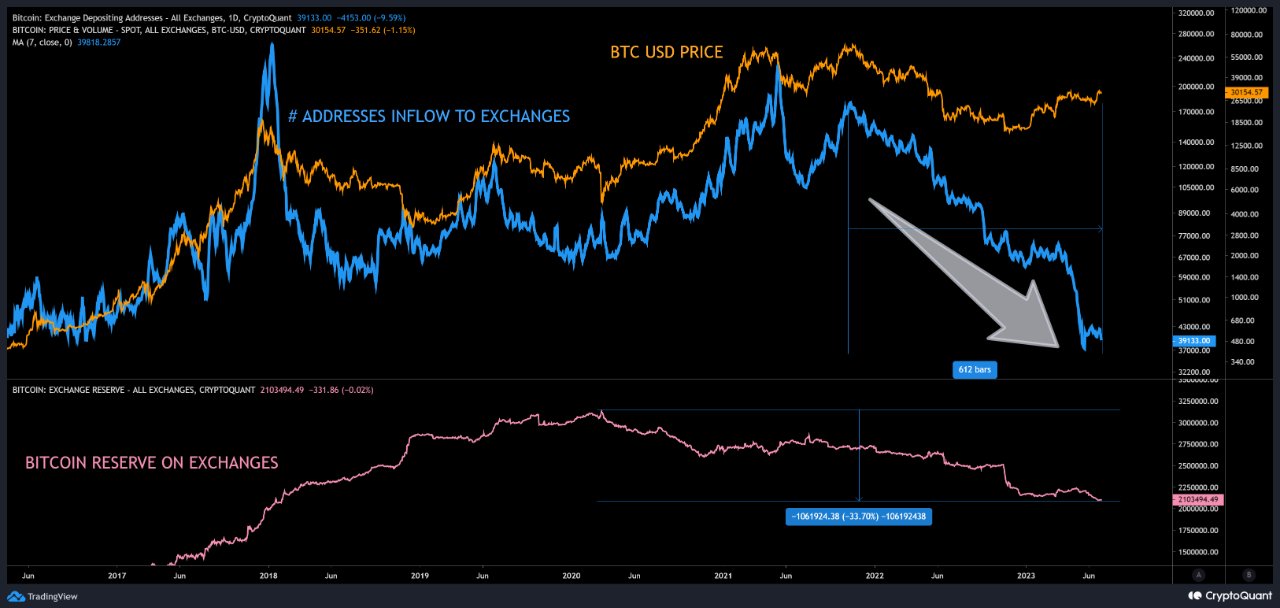
On July 2, 2023, CryptoQuant, a leading on-chain analytics firm, shared a Twitter thread that revealed a historic trend in Bitcoin’s market dynamics: the largest decline of Bitcoin inflows and supply in history.

CryptoQuant’s thread begins with a startling revelation: Bitcoin has seen an 80% decline over 612 days in the number of addresses logging inflows, marking the largest decline in history. This measurement starts from October 2021. However, if we consider the data from the May 2021 top, the decline in addresses rises to 84%.
This decline surpasses the previous record drop in addresses associated with inflows, which occurred between the 2017 parabolic top and the 2018 bear market, at 78.5%. It’s important to note that these figures do not account for the number of addresses that moved to purely self-custody, nor do they distinguish between different types of activity, such as miner activity or retail trading.
March 2020 marked the highest ever recorded supply of Bitcoin on exchanges, following a consistent ten-year growth trend. However, the 1200 days since have seen the first period of consistent decline in Bitcoin’s history. This shift in supply dynamics is significant and indicates a change in the way Bitcoin is being held and traded.
The thread suggests that these trends point to an enduring and positive evolution in the general perception of Bitcoin. This is further supported by recent developments in the financial world, such as BlackRock and other ETFs filing or re-filing, and the introduction of upcoming regulatory frameworks among leading markets, particularly the G20.
Moreover, both retail traders and institutions are holding more Bitcoin than ever. This could be a sign of increased confidence in Bitcoin’s long-term value and a shift away from short-term trading to long-term holding.
Featured Image Credit: Photo / illustration by MichaelWuensch via Pixabay


