The price of Solana ($SOL) has moved up nearly 30% over the last seven days to now trade above the $26 mark, as the cryptocurrency has been quickly recovering from the collapse of FTX, and as developers keep building on it.
According to available market data, Solana has been outperforming most other top digital assets over the last few weeks, going from a low under the $10 mark late last year to its current level amid a wider market recovery.
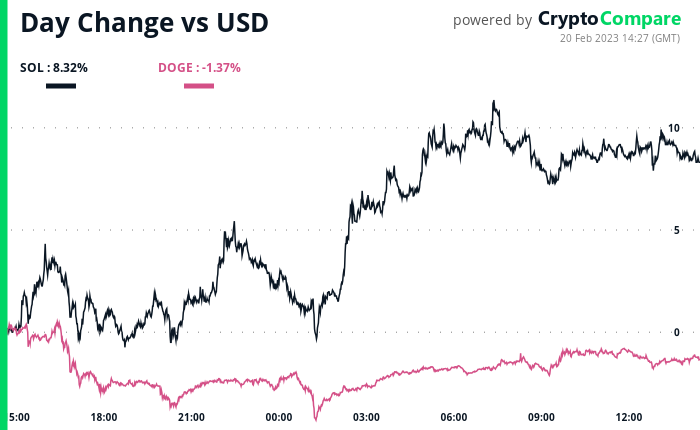
Solana currently has a market capitalization of $9.96 billion, making it the 11tth largest digital asset by the metric, above Polkadot ($DOT), which has a market capitalization of $8.7 billion, but below the meme-inspired cryptocurrency Dogecoin ($DOGE), which has an $11.73 billion market cap. SOL has notably been outperforming DOGE.

Solana is a blockchain network founded by former engineers from Qualcomm, Intel, and Dropbox that employs a delegated Proof-of-Stake (dPoS) consensus algorithm to achieve high performance. The network implements a distinctive approach to ordering transactions that substantially enhances its speed and throughput.
Historically, blockchain networks have faced challenges in scalability, and the few that have overcome them have encountered centralization issues. However, the creation of Solana in 2017 addressed the difficulty of developing a decentralized network with short confirmation times and low transaction fees.
According to CryptoCompare’s latest Asset Report, the cryptocurrency generated a 140% return in January to end the month at $23.9. Although the token’s value had dropped due to the decline of FTX, with an opening price of $36.9 on November 6th, it is gradually recovering.
At the beginning of the year, SOL surpassed its 50-day moving average and is now approaching its 200-day moving average, which concluded the month at $26.1, the report added.

The 200-day moving average is seen as a key technical indicator by traders and market analysts, as it helps determine the overall long-term market trends. A moving average, according to Investopedia, is an indicator that helps “smooth out price data by creating a constantly updated average price.”
The indicator eliminates the impact of random, short-term price fluctuations on the price of an asset, and the 200-day moving average is seen as either a strong support level if the price of the asset is above it, or a strong resistance if the price is below it. When an asset is above the 200-day moving average, it’s considered to be in an uptrend.
While DOGE’s movements have been smaller, the cryptocurrency has seen some noticeable whale accumulation. As CryptoGlobe reported, a massive whale on the network has recently accumulated a significant number of tokens, to the point they are now the 20th largest wallet on the cryptocurrency’s blockchain, with over 700 million DOGE.
Image Source
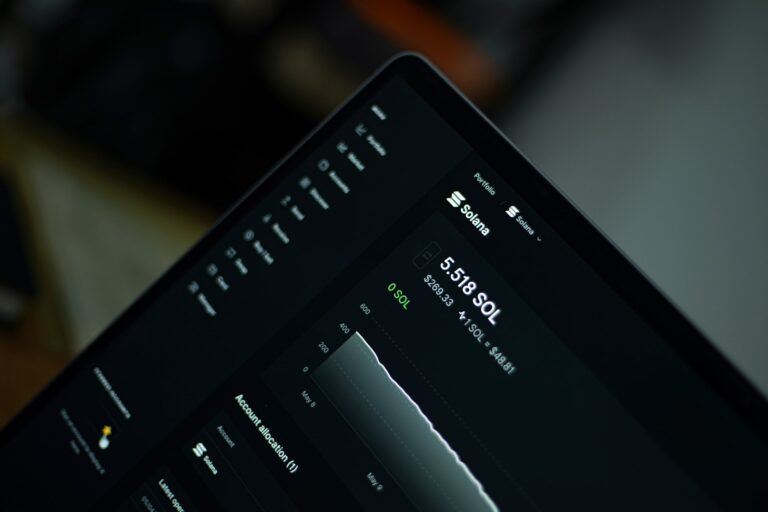
Featured image via Unsplash.


