The price of Bitcoin ($BTC) recently plunged to $31,000 after a series of withdrawals on the Anchor Protocol sled to the largest decentralized stablecoin, UST, losing its peg. Bitcoin’s crash has seen 40% of investors in the cryptocurrency sit on unrealized losses.
In response to the UST crisis, the Luna Foundation Guard deployed over 28,200 BTC to defend the UST’s peg. The added liquidity on exchanges and led to a recovery in UST’s price, which surged from its $0.61 low to $0.94 before falling again. The added liquidity may have added selling pressure to BTC.
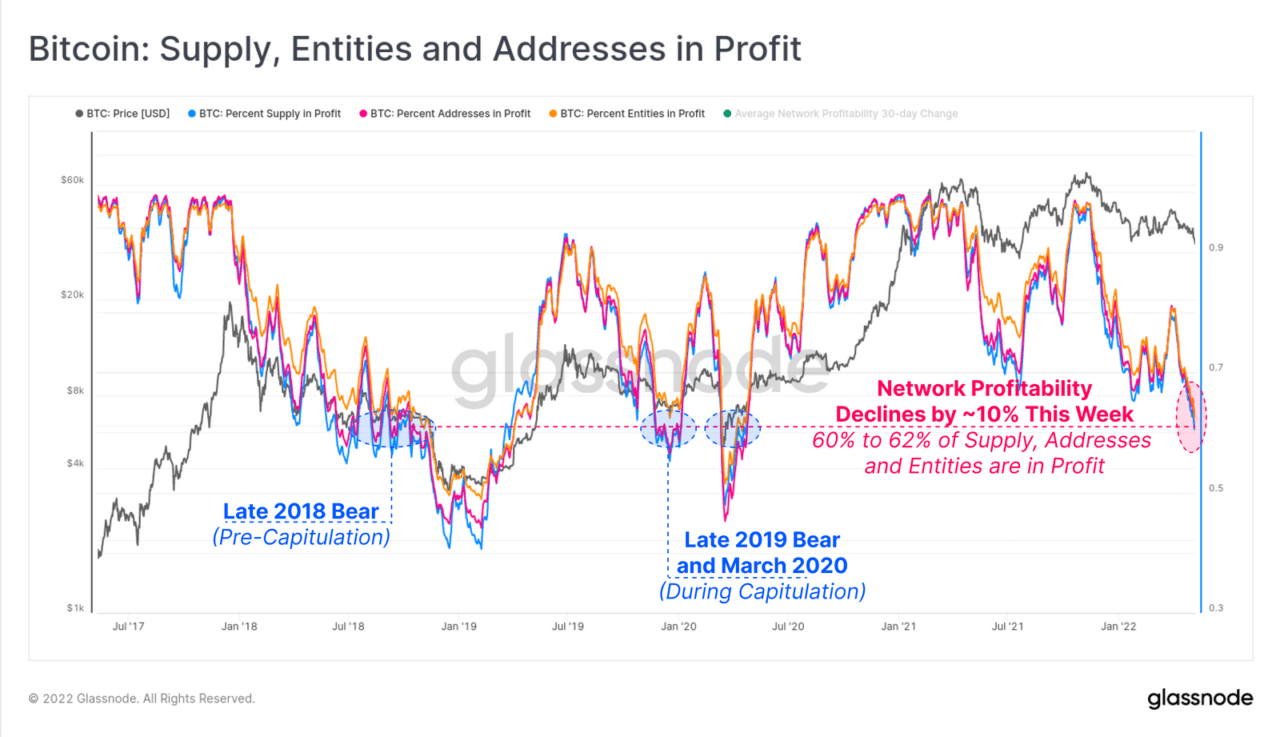
According to on-chain analytics firm Glassnode, network profitability defined as a “drop in the percentage of addresses, entities and/or supply in profit,” when BTC was trading at around $33,800 between 60% and 62% of BTC investors were in a state of profit, meaning around 40% were sitting on unrealized losses.

Glassnode added that these levels are “coincident with profitability seen in the late-2018, and late 2019-20 bear markets.” Per the firm, these levels occurred “prior to the final capitulation flush out event,” which means that “further downside remains a risk.”
CNBC reports that in the last month alone, 15.5% of all BTC wallets fell into an unrealized loss at a time in which the flagship cryptocurrency’s correlation to equities has been rising. That rising correlation has seen analysts at Bank of America challenge BTC’s role as an inflation hedge and instead suggest it trades as a risk asset.
Glasnode’s analysts noted an influx of “urgent transactions” entered Bitcoin’s mempools amid the sell-off, as investors were paying higher fees while seeking to “de-risk, sell, or re-collateralise their margin positions.” Per the firm, the total value of fees paid for on-chain transactions last week reached 3.07 BTC, which is the “largest value” recorded in its dataset to date.
The firm’s report also notes that 15.2% of on-chain transaction fees were “associated with exchange deposit transactions,” a figure higher than the one seen during the height of the 2017 bull-run and the May 2021 sell-off.
It adds that over $3.15 billion worth of the flagship cryptocurrency moved into or out of exchanges, the largest amount since the market hit an all-time high near $69,000 in November 2021. The report adds:
We can further dissect this into wallet cohorts, where we see that across the board, most wallet cohorts from shrimp to whales, have greatly softened in their onchain accumulation trends.
Per the report, entities with over 10,000 BTC have “ been a particularly significant distributive force over the last few weeks,” while retail investors with less than 1 BTC are the “strongest accumulators,” with a “notably weaker” accumulation than earlier this year.
As reported, Bank of America’s analysts expect the correlation between BTC and equities to remain in the near future. Moreover, while bitcoin has often been compared to gold, the correlation between the flagship cryptocurrency and the precious metal has dropped to near zero since June 2021, and has kept trending down.
DISCLAIMER
The views and opinions expressed by the author, or any people mentioned in this article, are for informational purposes only, and they do not constitute financial, investment, or other advice. Investing in or trading cryptoassets comes with a risk of financial loss.
IMAGE CREDIT
Featured image via Pixabay


