XRPUSD Medium-term Trend: Bearish
- Resistance Levels: $0.56, $0.58, $ 0.60
- Support Levels: $0.31, $0.29, $0.27
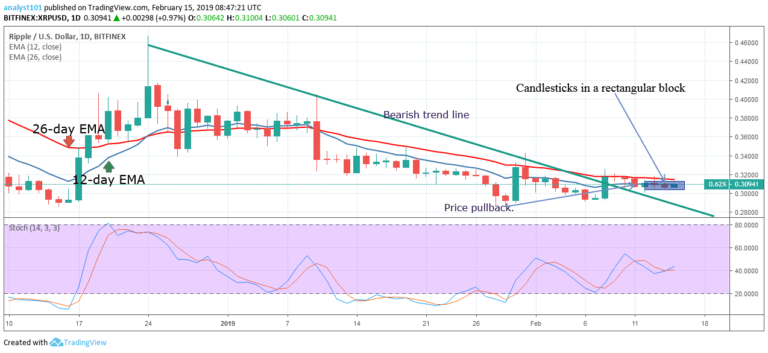
Last week XRP was in a bullish trend. The bulls broke the 12-day EMA and the 26-day EMA to hit a high of $0.33921. On April 18, a bullish candlestick tested the $0.35 resistance level and but failed to break it.
The crypto’s price ended up falling to a low at $0.32. The crypto’s bearish trend ended with a bullish candlestick breaking through its trendline. Its price will likely rise as a result, potentially breaking through its EMAs.
If the price falls below $0.32, it may test $0.30 or $0.31. The Stochastic indicator is in the oversold region above 20, indicating XRP is supported by bullish momentum.
XRPUSD Short-term Trend: Bullish
On the 4-hour chart, XRP is in a bearish trend. Last week the crypto’s price was in a bullish trend but whose gains have already been erased as it fell to $0.32. The crypto’s has resumed its bullish trend to break its 12-day EMA and the 26-day EMA.
If the bulls managed to break through XRP’s EMAs, its price may reach a $0.35, where it will face resistance. The Stochastic Oscillators are currently in the oversold region but above 20, indicating XRP’s bullish momentum.
The views and opinions expressed here do not reflect that of CryptoGlobe.com and do not constitute financial advice. Always do your own research.


