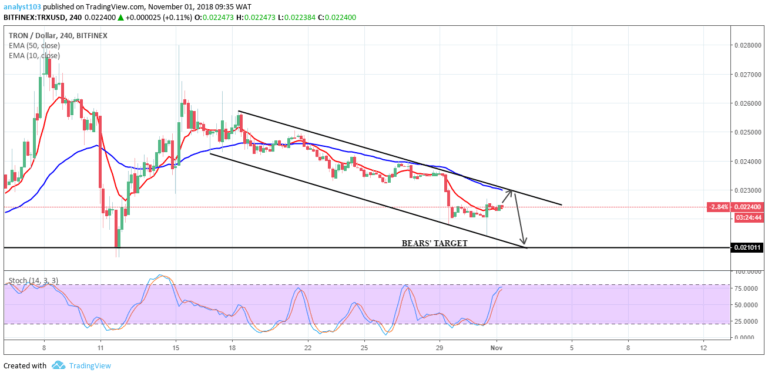
TRX/USD Medium-term Trend: Bearish
- Supply zones: $0.04000, $0.05000, $0.06000
- Demand zones: $0.01000, $0.00900, $0.00800
TRON continues in a downtrend in its medium-term outlook. The bulls had a brief control of the market with price up at $0.02539 in the supply area during yesterday’s session as the bearish flag matures. The gradual return of the bears was signaled by the bearish candle at $0.02527 around the 10-EMA.
The break of the trendline confirms the bears’ full takeover with a drop to $0.02426 before the end of yesterday session.
The pressure to the downside was strong as the market opens at today $0.02433. TRX is down at $0.02300 in the demand area.
Price is below the two EMAs, an indication of sellers’ presence with the stochastic oscillator signal pointing down at 16% in the oversold region. It suggests further downward movement in price in the medium-term.
TRX/USD Short-term Trend: Bearish
The cryptocurrency is in a bearish trend in its short-term outlook. The bears are back in the market since the break of the two EMAs at $0.02527 with a drop to $0.02452 before the close of yesterday’s market.
The bears sustained the momentum with a bearish 1-hour opening candle at $0.02457. TRX dropped to $0.02300 as the journey down south continued.
Price is below the two EMAs that are fanned apart which connotes strength and in this case the downtrend. The stochastic oscillator signal is pointing down at 21% suggesting downward momentum continuation in the short-term.
The views and opinions expressed here do not reflect that of CryptoGlobe.com and do not constitute financial advice. Always do your own research.


