XMRUSD Medium-term Trend: Ranging
- Supply zones: $120, $130, $140
- Demand zones: $ 50, $40, $30
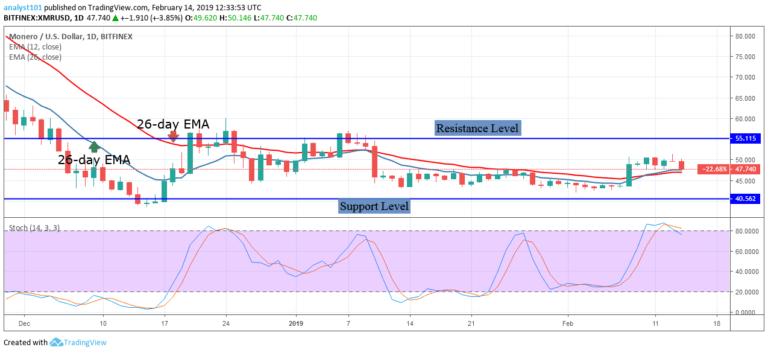
The XMRUSD pair is trading between the levels of $62.50 and $72 in the last two weeks. The bulls have not been able to break the $72 resistance level since April 2. If a price breaks the resistance level, the breakout will be powerful as it has been tested on more than three occasions.
On April 15, the price fell to the support of $62.50 and resumed a bullish movement. On April 16, the bulls resumed its bullish trend to test the $72 resistance level. The bulls failed to break the $72 resistance level, and the crypto’s price fell to the support level at the $62.50 price level.
Meanwhile, the Stochastic is in the overbought region but above the 40% range. This indicates that the price is in a bullish momentum and a buy signal.
XMRUSD Short-term Trend: Ranging
On the 4- hour chart, the price of Monero is in a range bound movement. Since April 3, the bulls failed to break the $72 price level on four occasions which is now a resistance level. The $64 price level had not been broken on more three occasions within the same period.
A price breakout or a price breakdown is imminent for the price of Monero. In a price breakout, if the $72 resistance level is broken, the crypto’s price may rally above $110 price level. A price breakdown will depreciate the crypto to a low at $55. Meanwhile, the Stochastic is out of the oversold region but above the 60% range. This indicates that the price is in a bullish momentum and a buy signal.
The views and opinions expressed here do not reflect that of CryptoGlobe.com and do not constitute financial advice. Always do your own research.


