ETHUSD Long-term Trend – Bearish
- Distribution territories: $200, $220, $240
- Accumulation territories: $120, $100, $80
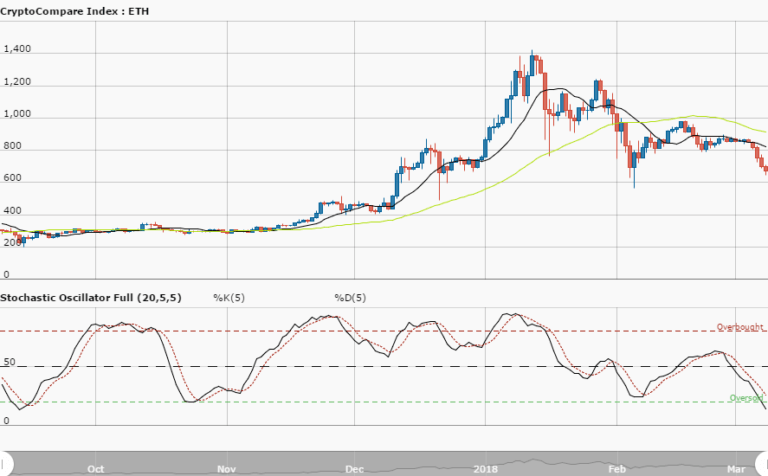
After going through a specific trading range for a few days, Ethereum’s price dropped on April 25, during a process that weakened the cryptocurrency to the point it went under the $160 mark. The crypto’s 14-day SMA is barely within its former $160 to $180 range.
Recently, ETH’s price dropped to a low of about $149, visible on the chart. Its 50-day SMA is now close to its price, but below its 14-day SMA. The Stochastic Oscillators are now pointing south close to range 20.
The bears are seemingly slowly building up over the bulls, although they still have to break through the 50-day SMA to keep dropping Ethereum’s price. While that plays out, a pattern could be spotted in the cryptocurrency’s price to give us a glimpse of its long-term trend.
The views and opinions expressed here do not reflect that of CryptoGlobe.com and do not constitute financial advice. Always do your own research.


