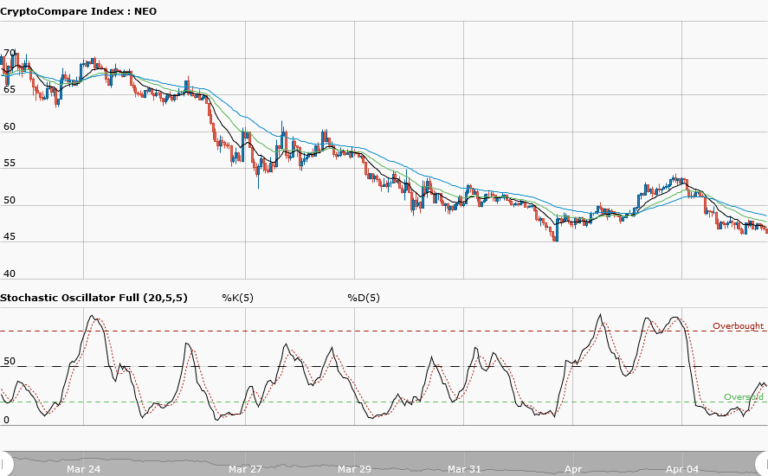
NEO/USD Long-term Trend: Bearish
- Supply zone: $15.00, $20.00, $25.00
- Demand zone: $3.00, $2.00, $1.00
NEO‘s long-term outlook returns to a bearish trend. The bears succesfully overcame the battle within the range of last week analysis breaking the $6.50 of the lower demand area on 6th December with a large bearish candle and closed lower at $6.02.
The bears’ journey down south was briefly halted after NEOUSD dropped to $5.46 on 7th December as the daily candle ended as a bullish hammer an indication of exhaustion denoted with the wick.
$7.09 in the supply area was the high the bullish pressure got the coin to on 9th December before it was rejected by the 50-EMA and the session ended as an inverted hammer.
It thus implies that the bullish momentum that resulted in the retest of the broken demand area was a pullback. This is important for the market correction before the bears resume the downward journey.
The stochastic oscillator is in the oversold region at 17% and it signal points up which implies a brief upward movement in price before the bears’ expected impulsive move and consequent downward momentum in the long-term.
The views and opinions expressed here do not reflect that of CryptoGlobe.com and do not constitute financial advice. Always do your own.


