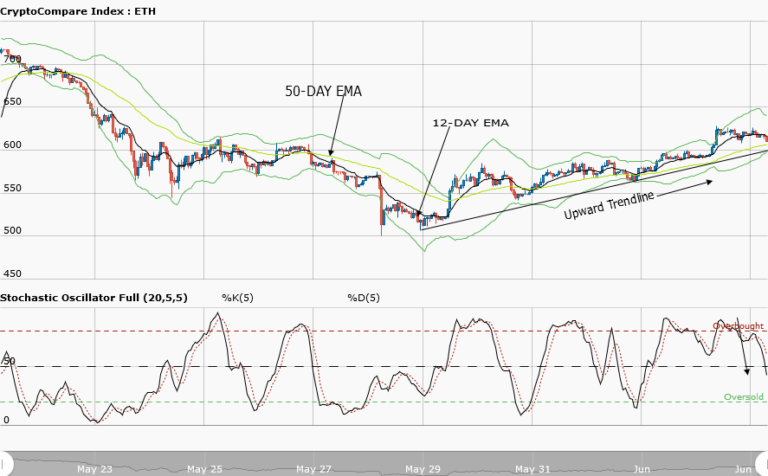
Ethereum Price Medium-term Trend: Bearish
Supply zones: $400, $450, $500
Demand zones: $150, $100, $50
ETH continues in a bearish trend in its medium-term outlook. The bullish retracement was terminated at $199.00 in the supply area which was also at the 23.6 fib level as the bulls lost momentum. The bears return was confirmed by the bearish inverted hammer at $197.82. Increased bearish momentum dropped ETHUSD to $195.89 in the demand area.
The bears’ pressure was more evident despite the bullish railroad formed late yesterday. The opening 4-hour candle at $197.33 was an inverted hammer that nullified the bullish momentum. The price was initially down to $196.50 in the demand area.
The price is below the two EMAs an indication of strong bearish pressure for trend continuation within the 23.6 fib level in the medium-term
Ethereum Price Short-term Trend: Bearish
ETH continues in a bearish trend in its short-term outlook. $199.00 in the supply area was the point bullish pressure was lost that started on the 29th, after the formation of the spinning top at $195.76 in the demand area. The bear pressure ensures ETHUSD attained a low of $195.61 in the demand area but the bulls gradually staged a comeback late yesterday.
ETHUSD was up at $198.10 earlier today but the 1-hour opening candle closed as an inverted hammer – a signal of a bearish return.
The marubozu candle formed at $197.23 confirming the bears’ takeover. The price is below the two EMAs and the stochastic oscillator is at 43% and its signal points down – an indication of bearish pressure.
As more candles formed and closed below the EMAs $195.00 in the demand area may be attained in the short-term.
The views and opinions expressed here do not reflect that of CryptoGlobe.com and do not constitute financial advice. Always do your own research.


