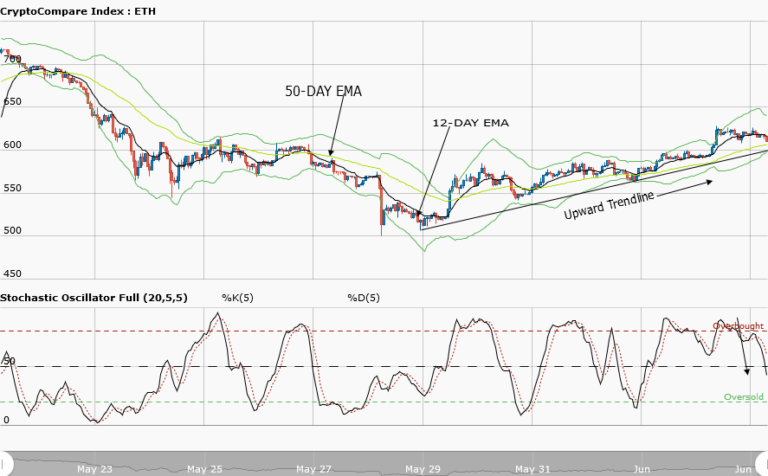
Ethereum Price Medium-term Trend: Bearish
Supply zones: $400, $450, $500
Demand zones: $150, $100, $50
ETH remains in a bearish trend in its medium-term outlook. The bears had a nice ride to the demand area at $195.00 – as predicted in yesterday’s analysis. After breaking out from the bearish pennant with a long-tailed bearish candle, increased bearish momentum led to a lower low at $195.10. The bulls gradually staged a comeback with ETHUSD closing as a bullish hammer at $196.50. The bullish 4-hour opening candle at $196.90 sustained the momentum with ETHUSD up at $198.00 in the supply area earlier today.
The bulls’ efforts still have the price within the 23.6 fib level, a trend continuation zone, which is a pullback. This is to validate the downtrend continuation, and also serve as a market correction.
Price is below the two EMAs which suggest bearish pressure and the stochastic oscillator is in the oversold region at 17% and it signal yet undefined.
The bears may stage a comeback at 23.6 or 38.2 fib levels and drop ETHUSD to $190.00 in the demand area in the medium-term.
Ethereum Price Short-term Trend: Bearish
ETH is in a bearish trend in its short-term outlook. The strong bearish pressure broke $203.00 in the lower demand area of yesterday’s range and pushed the price further down to $195.16 in the demand area but closes with a bullish engulfing candle at $196.07 an indication of the bulls return. ETHUSD was up at $198.68 earlier today.
The current pullback may push ETHUSD to the critical supply area as shown in the chart before the bears possibly stage a strong comeback.
The price is above the 10-EMA but below 50-EMA an indication that the bears’ are still within the market. The stochastic oscillator is in the overbought region at 80% and its signal pointing up – an indication of bullish retracement necessary for the market correction before downtrend continuation.
The views and opinions expressed here do not reflect that of CryptoGlobe.com and do not constitute financial advice. Always do your own research


