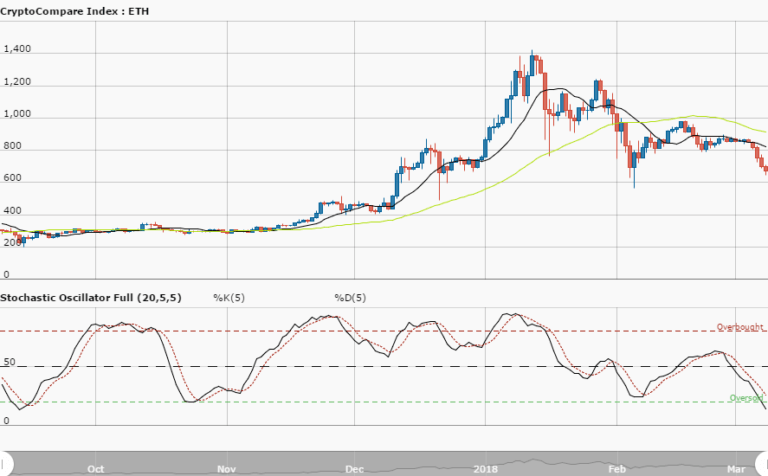
ETHUSD Long-term Trend – Ranging
Distribution territories: $500, $550, $600.
Accumulation territories: $200, $150, $100.
Ethereum’s price has been moving in a range-bound zone between the territories of $330 and $250 over the past week. The cryptocurrency recorded lower highs and lower lows in said period, and today, September 2, saw its price push past the 14-day SMA. It’s still under the 50-day SMA.
The cryptocurrency’s price has been slowly averaging towards the $330 mark. The 50-day SMA is located below the distribution territory of $400, as the 14-day SMA is slightly bent northward below it.
The Stochastic Oscillators have moved past range 40 to point north. This suggests a bullish movement is still going. A bullish trend is expected to be confirmed if the cryptocurrency manages to breach the $330 mark and manages to stay above it for some time. A bullish push could encounter a strong distribution territory at $350, and as a result, ETH’s price could be driven southward towards the $250 mark. Investors can wait until the cryptocurrency drops to buy it.
The views and opinions expressed here do not reflect that of CryptoGlobe.com and do not constitute financial advice. Always do your own research.


