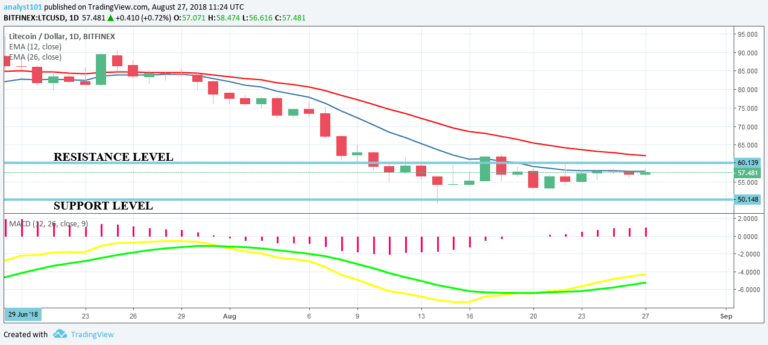
 Litecoin Chart by Trading View
LTCUSD Medium-term Trend: Ranging
Resistance Levels: $60, $70, $80
Support Levels: $50, $40, $30
The LTCUSD pair is range bound. Last week the price of Litecoin fell to a low of $53.54. Then at that low, the price was fluctuating in a horizontal pattern all throughout the week. Today, the cryptocurrency is still fluctuating in that pattern. Its price is likely going to continue its range bound movement between the levels of $60 and $50.
The horizontal movement is a period of consolidation, and in the event of a breakout the pressure will be very powerful. A bearish trend will see LTC’s price since to a low of $49.31. On the other hand, a bullish breakout will see its price reach a high of $75.32 . Nevertheless, the MACD and signal lines are below the zero line which indicates a sell signal.
The price of Litecoin is below the 12-day EMA and the 26-day EMA which indicates that the price is falling
LTCUSD Short-term Trend: Ranging
 Litecoin Chart by Trading View
On the 4-hour chart, LTC is range bound. Its price, the 12-day EMA and the 26-day EMA are trending horizontally indicating the cryptocurrency is range bound. Meanwhile, the Relative Strength Index period 14 is level 55 which indicates that its price is in a range bound trend.
The views and opinions expressed here do not reflect that of CryptoGlobe.com and do not constitute financial advice. Always do your own research.


