The sentiment graph above is calculated using algorithmic text analysis which classifies a Tweet as positive or negative on a scale from +1 to -1, this is done per individual tweet over 100+ cryptocurrencies. By looking at sentiment over time it establishes a baseline to see if sentiment is becoming more positive or more negative.
Last week there was a significant increase in sentiment preceding the upward correction in overall market cap from July 2nd. Today there is a significant downturn in sentiment that suggest the recent rally will be short-lived. Sentiment is still at moderate level so it is too early to draw conclusions. To see how it will evolve over the coming days subscribe to the newsletter at AltcoinAnalytics.com.
Exposure
Exposure represents the aggregate recipients for crypto related tweets and it is continuing its downward trend. Overall recipients has seen a small but steady decline over last month. This can also be due to the bot clean up performed by Twitter itself, with over 70 million accounts deleted in the past month. To see how bot noise is eliminated also see the NEO update below.

Sentiment on Crypto Newsites
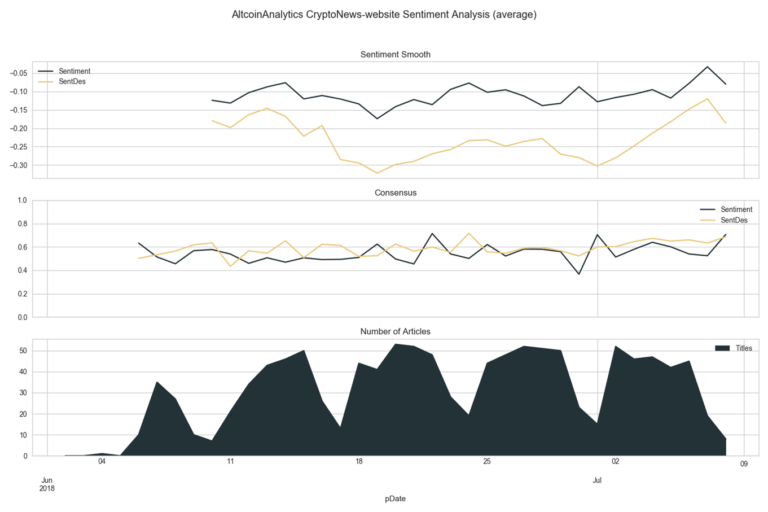
The graph below shows a brand-new sentiment indicator. The indicator analyses headlines of large crypto-related websites and calculates sentiment. In other words, it measures if headlines are becoming more positive or negative, the three subplots show:

Sentiment: Sentiment of crypto headlines over time (summed over all articles). If headlines are increasing more positive than this indicator goes down and vice versa. Sentiment is shown for the sentiment of headlines (Sentiment, blue line) and for the description of the article (SentDes, yellow line)
Consensus: Shows if there is much dispersion across articles or if they have similar sentiment. Ie it shows if one website is positive while the other is negative, or if all websites are commonly positive or negative
Number of articles analysed: Shows the count per day of articles analysed. It shows for example that there are somewhat less articles published in the weekend compared to weekdays
News sentiment on crypto related websites is also somewhat decreasing, after some significant increases since the start of July. The rise in sentiment from the start of July is represented in the bullish market in the first week of July.
Individual Analysis on NEO

Finally, there is the individual analysis of NEO. The plot below shows (1) Market cap, and (2) sentiment of Twitter accounts with significant number of followers. This eliminates sentiment of bots and only allows for messages for which many people see value. Again, it shows sentiment picking up before prices move up. For analysis of more crypto’s visit AltcoinAnalytics.com


