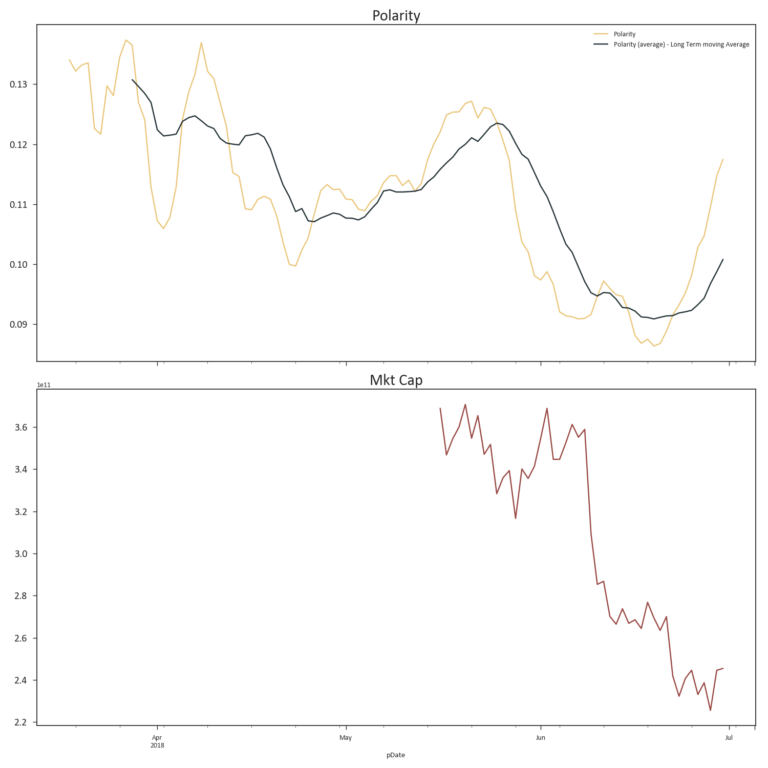
Quantitative sentiment polarity has increased significantly over the last week which suggests bullish action to come over the next week. Overall exposure of crypto related tweets has dropped slightly. Individual analysis of cryptoassets highlighted some impressive buy signals such as Po.et (POE). For up to date analysis visit AltcoinAnalytics.
Sentiment Is Bullish
Sentiment in the graph above is calculated using algorithmic text analysis which classifies a Tweet as positive or negative on a scale from +1 to -1, this is done per individual tweet over 100+ cryptocurrencies. By looking at sentiment over time it establishes a baseline to see if sentiment is becoming more positive or more negative.
In previous posts a falling sentiment preceded a bear spell. From the polarity chart below a sharp drop from late May to mid-June can be observed in the sentiment. The drop was matched by a sharp drop in market cap the following week.
Interestingly quantitative sentiment polarity has shown its most significant uptick since March. As such the indicator is suggesting a rally will occur. Bitcoin has bounced aggressively from the 8-month low of $5,800 but it is yet to be seen if the entire crypto market will rally as the indicator suggests.

Though the past movements of the quantitative sentiment analysis showed accurate signalling, it is important to note this indicator is a tool in your toolbox, not a crystal ball.
Exposure is Decreasing
Despite sentiment improving significantly, the overall Twitter reach is on a slow and steady decline. The chart below shows the total of all Twitter recipients. The last few weeks this has been on a steady decline, which could indicate a loss of interest or exposure of the mainstream crypto followers.

Individual Analysis Highlights Winners
The bars in the chart below show the score of a cryptoasset relative to its market cap. For example, it is expected that Bitcoin will have more Twitter exposure compared to smaller coin. Therefore, all indicators are scored relative to the respective market cap size. This is then transformed in to a Z-score, which essentially tells how much a crypto is scoring higher compared to the overall average. The four charts show;
- Most exposure (Tweets * followers) relative to market cap (top left)
- Most positive sentiment (sum of positive Tweets minus negative tweets) relative to size (top right)
- Most Tweets relative to market cap (bottom left)
- Most positive average sentiment (bottom right

$POE is the most notable cryptoasset here as it has the highest z-scores for recipients and sentiment and is placed 4th highest for exposure. This analysis was conducted on the 30th of July and in the preceding day the price of Poet increased 60% which can be seen in the CryptoCompare chart below. The analysis appears to have indicated cryptos that had uncaptured value.

For those interested in more regular updates and additional graphs, feel free to visit www.AltcoinAnalytics.com and subscribe to the newsletter.


