
Introduction
This report provides a comprehensive analysis of XRP (XRP) for 4 July 2023. The data includes real-time price, volume, bid/ask, day’s range, technical indicators, and moving averages.
Price and Volume Overview
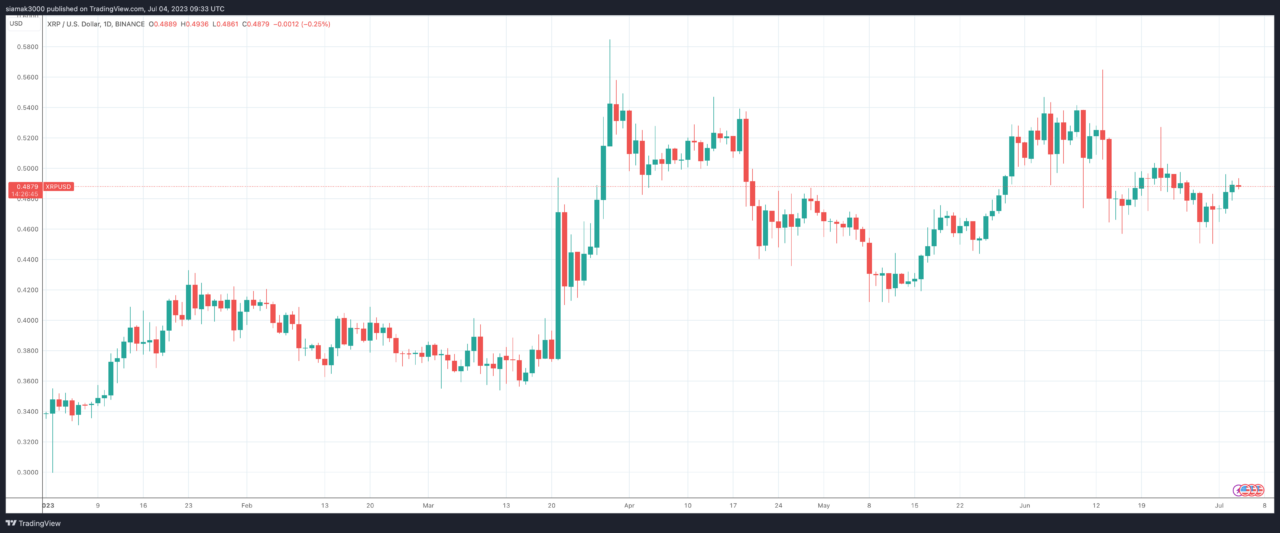
As of 8:57 a.m. UTC on 4 July 2023, on Binance, XRP is trading at $0.48830, up by $0.00460 (+0.95%) from its previous close. The trading volume over the last 24 hours was 338,218,317 XRP. The bid price is $0.48820, and the ask price is $0.48830. The day’s range is between $0.47900 and $0.49350.
Technical Indicators
Technical indicators are mathematical calculations based on a cryptocurrency’s price and volume. Changes in these indicators can signal changes in market trends.
Here’s a detailed breakdown of the technical indicators for XRP:
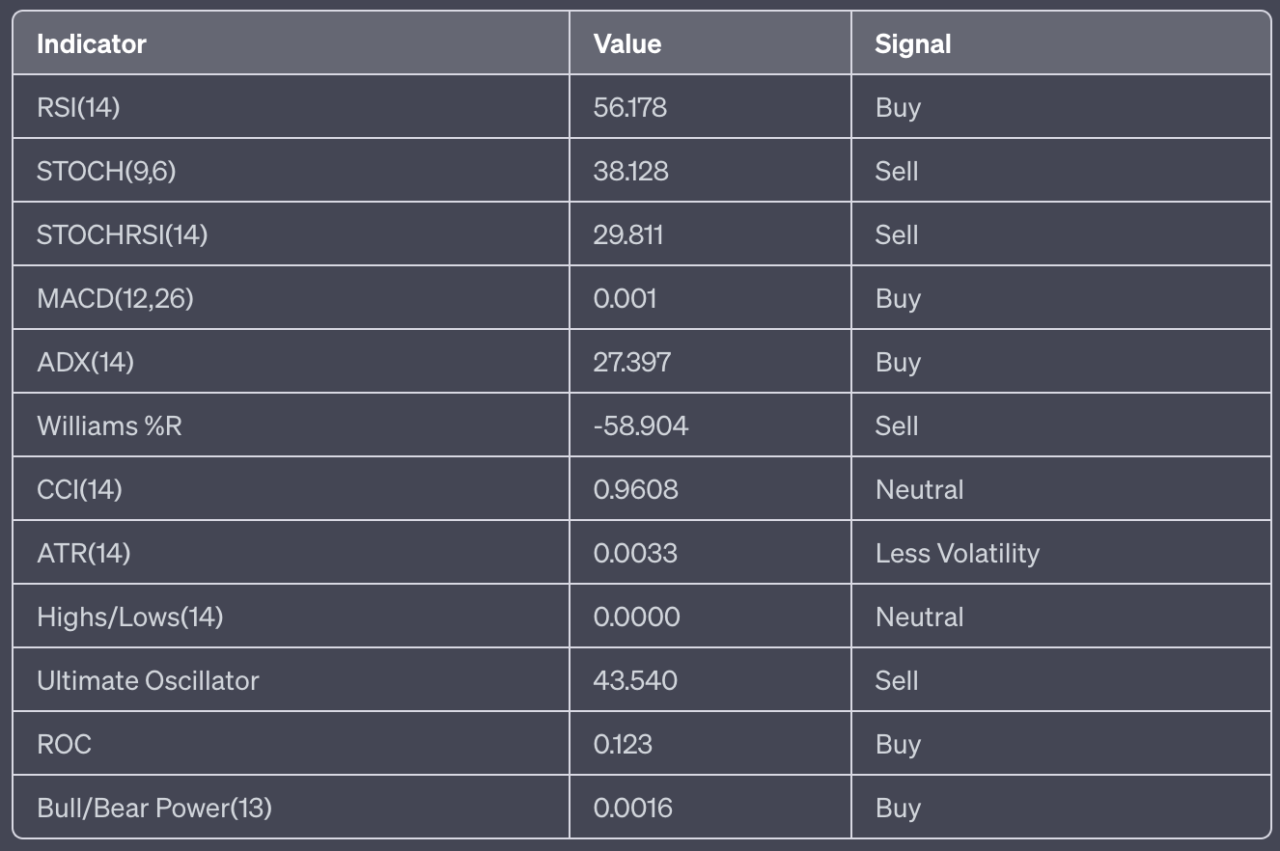
- RSI(14): The 14-day Relative Strength Index is 56.178, indicating a buy position. The RSI measures the speed and change of price movements on a scale of 0 to 100. Traditionally, the asset is considered overbought when the RSI is above 70 and oversold when it’s below 30. In this case, XRP is closer to the overbought range, suggesting bullish momentum.
- STOCH(9,6): The Stochastic Oscillator is 38.128, indicating a sell condition. This momentum indicator compares a particular closing price of the asset to a range of its prices over a certain period of time. The current value suggests that XRP is closer to its lows than its highs, which is typically viewed as a bearish signal.
- STOCHRSI(14): The Stochastic RSI is 29.811, indicating a sell condition. This is a technical momentum indicator that compares the level of the RSI to its high-low range over a set time period. A sell condition could indicate a selling opportunity as the price might decrease soon.
- MACD(12,26): The Moving Average Convergence Divergence is 0.001, indicating a buy position. The MACD is a trend-following momentum indicator that shows the relationship between two moving averages of a security’s price. The MACD line crossing below the signal line can be a bearish signal, and when it crosses above, it can be a bullish signal. In this case, the MACD line is above the signal line, indicating a bullish signal.
- ADX(14): The Average Directional Index is 27.397, indicating a buy position. The ADX is used to measure the strength or weakness of a trend, not the actual direction. Values above 25 may indicate a strong trend.
- Williams %R: The Williams %R is -58.904, indicating a sell condition. This momentum indicator measures overbought and oversold levels. Readings above -20 are considered overbought, and readings below -80 are considered oversold. The current reading suggests that XRP is in an oversold condition.
- CCI(14): The Commodity Channel Index is 0.9608, indicating a neutral position. The CCI is a momentum-based oscillator used to help determine when an investment vehicle is reaching a condition of being overbought or oversold. A CCI above 100 may indicate an overbought condition, while a CCI below -100 may indicate an oversold condition.
- ATR(14): The Average True Range is 0.0033, indicating less volatility. The ATR is a technical analysis indicator that measures market volatility by decomposing the entire range of an asset pricefor that period. Lower values typically represent less volatility and smaller price movements.
- Highs/Lows(14): The value is 0.0000, indicating a neutral position. This indicator is used to identify the highest and lowest prices for the asset over a particular period.
- Ultimate Oscillator: The value is 43.540, indicating a sell position. This is a technical indicator that is used to measure momentum across multiple timeframes. A value below 30 often indicates an oversold condition, while a value above 70 indicates an overbought condition.
- ROC: The Rate of Change is 0.123, indicating a buy position. The ROC is a momentum oscillator, which measures the percentage change between the current price and the n-period past price. A positive ROC indicates a bullish signal, suggesting that the price is increasing.
- Bull/Bear Power(13): The value is 0.0016, indicating a buy position. These indicators measure the balance of power between bulls (buyers) and bears (sellers). A positive value indicates that bulls are in control.
Overall, the technical indicators present a mixed picture for XRP. While some indicators suggest a buy condition, others indicate a sell or neutral condition. This suggests that the market is somewhat uncertain, and traders should proceed with caution.
Moving Averages
Moving averages are a type of data smoothing technique that analysts use in technical analysis to identify trends in a set of data, such as stock prices. They help to reduce the noise and fluctuation in price data to present a smoother line, making it easier to see the overall direction or trend.
Here’s a detailed breakdown of the moving averages for XRP:
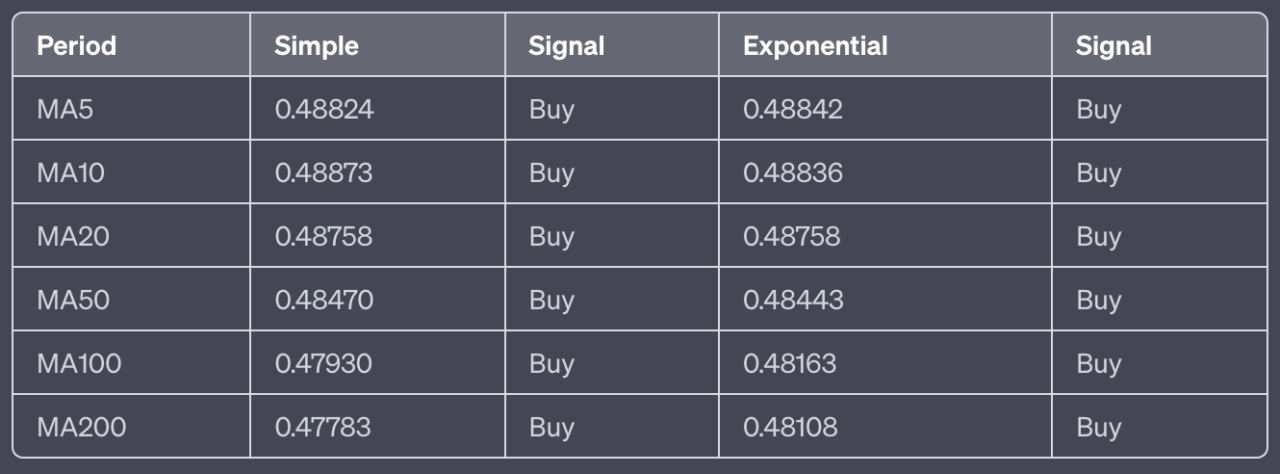
- MA5: The 5-day moving average is 0.48824 (simple) and 0.48842 (exponential), both indicating a buy position. This suggests that the price is above the average of the past 5 days, which is a bullish signal.
- MA10: The 10-day moving average is 0.48873 (simple) and 0.48836 (exponential), both indicating a buy position. This suggests that the price is above the average of the past 10 days, which is a bullish signal.
- MA20: The 20-day moving average is 0.48758 (simple and exponential), both indicating a buy position. This suggests that the price is above the average of the past 20 days, which is a bullish signal.
- MA50: The 50-day moving average is 0.48470 (simple) and 0.48443 (exponential), both indicating a buy position. This suggests that the price is above the average of the past 50 days, which is a bullish signal.
- MA100: The 100-day moving average is 0.47930 (simple) and 0.48163 (exponential), both indicating a buy position. This suggests that the price is above the average of the past 100 days, which is a bullish signal.
- MA200: The 200-day moving average is 0.47783 (simple) and 0.48108 (exponential), both indicating a buy position. This suggests that the price is above the average of the past 200 days, which is a bullish signal.
Conclusion
The overall market sentiment for XRP as of 4 July 2023 is leaning toward the bullish side. The technical indicators present a mixed signal with five buy signals, four sell signals, and two neutral signals. However, the moving averages are strongly bullish, with all twelve signals indicating a buy. This suggests that despite some short-term volatility, the overall trend for XRP is upward. As always, these insights should be used in conjunction with other market information and personal research when making investment decisions.
Featured Image Credit: Photo / illustration by “Dylan Calluy” via Unsplash