

LTCUSD Medium-term Trend: Bullish
- Resistance Levels: $60, $65, $70
- Support Levels: $50, $40, $30
Yesterday, March 18, the LTCUSD pair was in a bearish trend. On March 16, the bulls tested the $64 resistance level, and the crypto’s price fell to a sideways trend. Yesterday, the bulls made another attempt and were resisted and the bears broke the 12-day EMA, the 26-day EMA and the price fell to a low at $ 60.21.
In the last 24 hours, the crypto’s price was in a range bound movement. Today, the bulls are attempting to break above the EMAs. On the upside, if the bulls break above the EMAs, the crypto’s price will retest or break the $64 resistance level.
On the downside, if the bulls fail to break above the EMAs, the crypto’s price will resume its range bound movement. Meanwhile, the stochastic is in the oversold region and but above the 20% range which indicates that the crypto is in bullish momentum and a buy signal.
LTCUSD Short-term Trend: Bullish

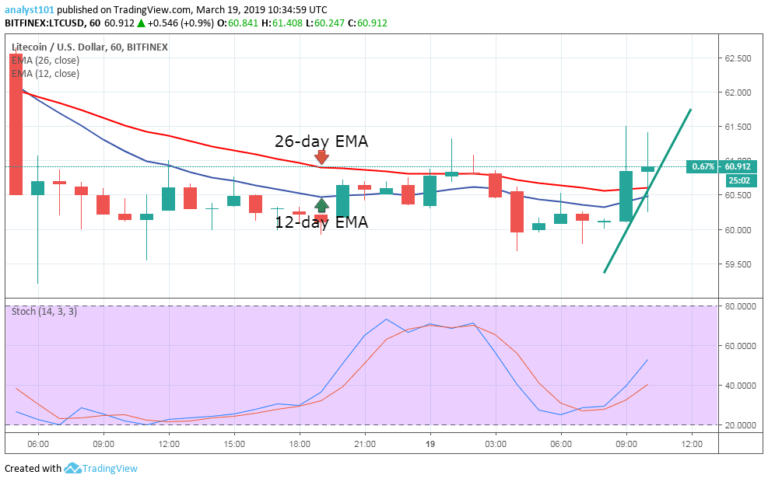
On the 1-hour chart, the price of Litecoin is in a bullish trend. On March 18, the bulls tested the $64 resistance level and were resisted. The resultant effect was that the price of Litecoin fell from its recent high. The bears broke the EMAs as the price fell to a low at $60.50.
The crypto’s price is above the EMA which indicates that the price is likely to rise. A trend line has been drawn to determine the duration of the bullish trend. The assumption is that the bullish trend is ongoing as long as the trend line is unbroken. Today, the bullish trend is ongoing.
Meanwhile, the stochastic is out of the oversold region and but above the 20% range which indicates that the crypto is in bullish momentum and a buy signal.
The views and opinions expressed here do not reflect that of CryptoGlobe.com and do not constitute financial advice. Always do your own research.


