

ADAUSD Medium-term Trend: Ranging
- Resistance levels: $0.080, $0.090, $0.100
- Support levels: $0.040, $0.030, $0.020
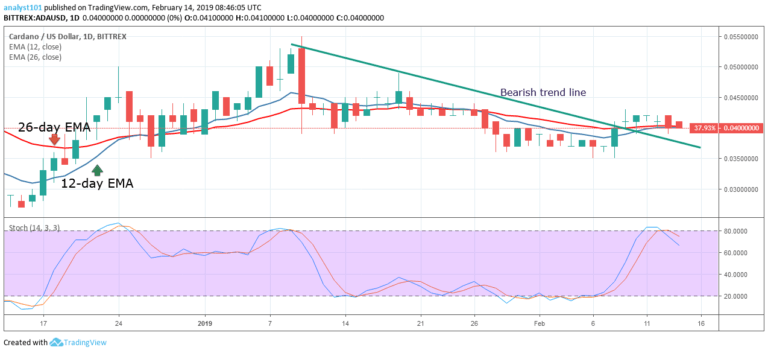
On February 24, a bearish candlestick broke the 12-day EMA and the 26-day EMA as the price of ADA fell to a low of $0.41. Currently, the price of Cardano is trading between $0.040 and $0.045. The crypto’s price is trading in a tight range it is neither in a bullish nor in a bearish trend.
The 12-day EMA and the 26-day EMA are trending horizontally indicating a sideways trend. Today, the price is falling and approaching a low of $0.042. If the crypto’s price falls to $0.040, ADA will enter a bullish move to the $0.045 level.
Meanwhile, the Stochastic is in the overbought region but above 20. This indicates that the price of Cardano is in a bullish momentum and is a buy signal.
ADAUSD Short-term Trend:Ranging

On the 4-hour chart, the crypto’s price is in a sideways trend. Cardano’s price is fluctuating between the $0.040 and $0.045 levels. On March 4, the bears tested the lower price level and were resisted. As a range-bound trader, a long position should be entered at $0.040.
You can exit this long position near the upper price level. On the other hand, if the bulls were resisted at the upper level, a short position should be initiated. The Stochastic is in the overbought region but above 80. This indicates that the price of Cardano is in a strong bullish momentum and is a buy signal.
The views and opinions expressed here do not reflect that of CryptoGlobe.com and do not constitute financial advice. Always do your own research.


