

ADAUSD Medium-term Trend: Bearish
- Resistance levels: $0.080, $0.090, $0.100
- Support levels: $0.030, $0.020, $0.010
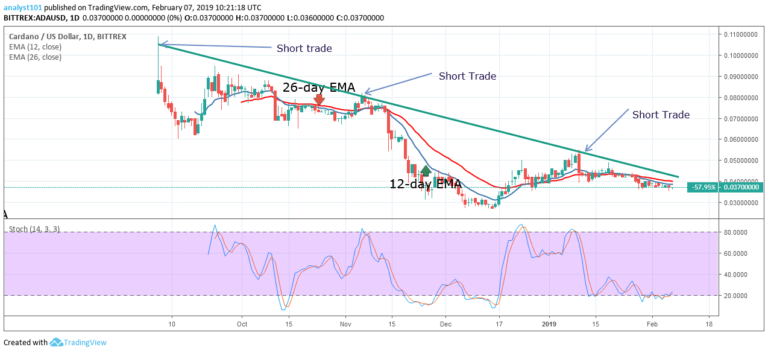
The price of Cardano had been in a bearish trend since September 6, 2018. A bearish trend line is drawn to show the resistance levels where traders could have made short trades. Another peculiar thing is that the trend line had not been broken. On January 10, the trend line was tested and the price bounced back which resulted in the continuation of the bearish trend.
Today, the crypto is below the 12-day EMA and the 26-day EMA which indicates that the price is likely to fall. On the upside, if the price breaks the EMAs and it is sustained above the EMAs, the crypto is likely to resume a bullish trend to break the trend line. Meanwhile, the stochastic is in the oversold region but below the 20% range. This indicates the price of Cardano is in a strong bearish momentum and a sell signal.
ADAUSD Short-term Trend: Ranging

On the 4-hour chart, the crypto’s price is in a bearish trend. The price of Cardano had earlier been trading between the levels of $0.0400 and $0.0460 since January 10. On January 28, the bears broke the $0.0390 price level and fell to the low of $0.0360. The crypto’s price is now ranging between the levels of $0.0360 and $0.0390 .
Meanwhile, the price of Cardano is below the 12-day EMA and the 26-day EMA which indicates that the price is in the bearish trend zone. The MACD line and the signal line are below the zero line which indicates a sell signal.
The views and opinions expressed here do not reflect that of CryptoGlobe.com and do not constitute financial advice. Always do your own research.


