

ADAUSD Medium-term Trend: Ranging
- Resistance levels: $0.080, $0.090, $0.100
- Support levels: $0.040, $0.030, $0.020
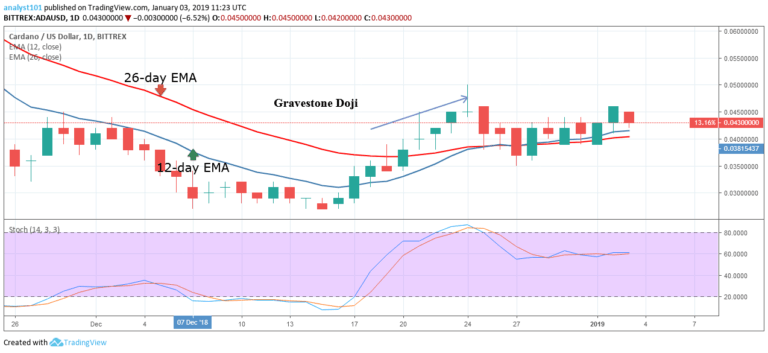
On December 24, ADAUSD pair had been ranging above the $0.040 price level. On the same date, a Gravestone Doji reversal candlestick terminated an uptrend which made the crypto to fall to the low of $0.0370 but the price pulled back to the high of $0.042. On January 1, the price of Cardano was in a bullish trend and price reached the high of $0.046.
The crypto’s price fell to the low of $0.0433 because of the resistance at $0.045. On the upside, the crypto’s price has to break the resistance at $0.0450 by having more buyers at that price level. If the bulls overcome the resistance which had been tested on more than three occasions, the crypto will reach the previous high of $0.050.
On the downside, if the bears break the $0.040 price level the crypto will revisit the previous lows of $0.030 and $0.035.
ADAUSD Short-term Trend: Ranging

On the 4-hour chart, the crypto’s price is in a sideways trend. From the chart, the 12-day EMA and the 26-day EMA are trending horizontally indicating that the price of Cardano is ranging. The price of Cardano is range bound between the levels of $0.035 and $0.045. On January 1, the crypto tested the upper price level and it was resisted.
However, while, the crypto continues its range bound movement, traders can trade the upper and lower price levels. That is, you initiate a short trade at the upper price level and exit at the support level. On the other hand, you initiate a long trade at the lower price level and exit at the resistance level.
The views and opinions expressed here do not reflect that of CryptoGlobe.com and do not constitute financial advice. Always do your own research.


