
XMR/USD Long-term Trend: Bearish
Resistance levels: $120, $130, $140
Support levels: $50, $40, $30
Monero (XMR) was in a bearish trend during the month of November. On the first day, its price opened at $105.3 but ended up falling down to $58.6 by the end of the month. In other words, XMR lost over 44.6% of its value last month. It has now fallen to a low of little over $53.
The cryptocurrency is currently in a range-bound movement. Since November 25 XMR’s price has been fluctuating between $53 and $65. The bears have, on three separate occasions, been unable to break its support. If they succeed, XMR will go down to $40.

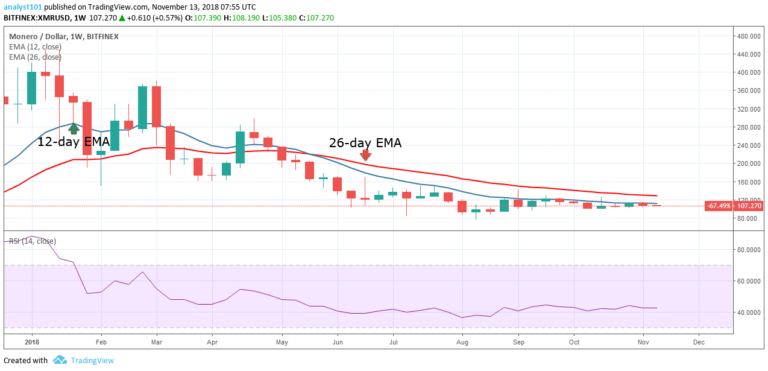
On the other hand if the bulls manage to take over, XMR will go up to $65 where it’s set to face resistance. Its price is below the 12 and 26-day EMAs, which indicates a downtrend is probable. The Stochastic Oscillator is below range 20, meaning there’s a strong bearish momentum keeping it there.
The views and opinions expressed here do not reflect that of CryptoGlobe.com and do not constitute financial advice. Always do your own research.


